Curated OER
Charts, Maps, and Graphs Lesson on the Holocaust
Learners practice interpreting data. In this Holocaust lesson, students research selected Internet sources and examine charts, maps, and graphs regarding the Jewish populations in and out of Europe. Learners respond to questions about...
K-State Research and Extensions
Water
How are maps like fish? They both have scales. The chapter includes six different activities at three different levels. Scholars complete activities using natural resources, learn how to read a map, see how to make a compass rosette,...
Conneticut Department of Education
Instructional Strategies That Facilitate Learning Across Content Areas
Imagine 28 instructional strategies, appropriate for all subject areas and all grade levels. Directed Reading-Thinking Activities (DRTA), Question-Answer Relationship (QAR) activities, KWL charts, comparison matrixes, classification...
PBS
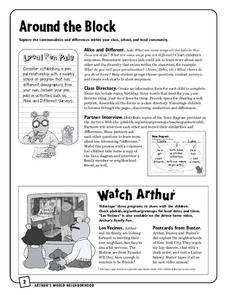
Around the Block
Arthur and his friends help children explore the concepts of family, community, and diversity in a fun series of activities. From performing peer interviews to mapping out the different places learners have lived or visited, this...
Texas State Energy Conservation Office
Investigation: Concept Mapping Fuels
After reading an article, "Fuels for Everything," collaborative groups create a concept map poster of the transportation and non-transportation fuels. This makes a strong introduction to the different types of fuels used for transportion...
Curated OER
Mapping Perceptions of China
Students discuss what types of things are included on a map. They compare and contrast maps of China with a map they create and practice using different types of maps. They write analysis of their classmates maps.
Tennessee State Museum
An Emancipation Proclamation Map Lesson
Did the Emancipation Proclamation free all slaves during the Civil War? Why was it written, and what were its immediate and long-term effects? After reading primary source materials, constructing political maps representing information...
Curriculum Corner
Camping Literacy Pack
Increase camping vocabulary just in time for summer with a camping themed literacy pack. Use word cards and sentence cards to enhance fluency, build vocabulary, and strengthen writing skills. The activities are perfect for centers,...
Curated OER
Lively Read of the Tale of Despereaux
Students create a character map of the main characters in The Tale of Despereaux. After reading the text, students create a character chart based on information they gleaned from the story. They use this information to write a letter...
Curated OER
Map It!
Fourth graders demonstrate map making skills by using the computer to create maps of the geographic features, regions, and economy for their state.
Education World
The African American Population in US History
How has the African American population changed over the years? Learners use charts, statistical data, and maps to see how populations in African American communities have changed since the 1860s. Activity modifications are included to...
Curated OER
A world of oil
Students practice in analyzing spatial data in maps and graphic presentations while studying the distribution of fossil fuel resources. They study, analyze, and map the distribution of fossil fuels on blank maps. Students discuss gas...
Curated OER
Using a Concept Definition Map
Students define "natural disaster" by offering examples and charting them to discover what a concept definition map is. Then students create their own maps using the word "city".
Smithsonian Institution
A Ticket to Philly—In 1769: Thinking about Cities, Then and Now
While cities had only a small fraction of the population in colonial America, they played a significant role in pre-revolutionary years, and this was certainly true for the largest city in the North American colonies: Philadelphia. Your...
Constitutional Rights Foundation
Refugees From Vietnam and Cambodia
The United States may have pulled its troops from the Vietnam War in 1973, but the conflict was far from over for the citizens living in Asia at the time. An informative resource lets learners know about the wave of over 220,000...
Annenberg Foundation
Mapping Initial Encounters
Picture someone's excitement of seeing a horse for the first time. How about a cow? The Columbian Exchange changed life for not only Native Americans, but also for Europeans and the entire world. The second lesson of a 22-part series...
Curated OER
Drawing A Map
Young scholars discuss any information they already know about maps. As a class, they draw a map of a park following written directions making sure to include a compass rose and key. They are graded based on a rubric and discuss the need...
Curated OER
Maryland’s Chesapeake Bay Landscape Long Ago and Today
Combine a fantastic review of primary source analysis with a study of Captain John Smith's influence on the Chesapeake Bay region in the seventeenth century. Your young historians will use images, a primary source excerpt, and maps...
Film Education
The Jungle Book
Accompany a viewing of Disney's live-action feature film, The Jungle Book, with a packet equipped with several activities focused on story elements. Scholars discuss and complete diagrams and charts about the movie's characters, setting,...
Curated OER
Map It With Pixie
Fourth graders use the computer program 'Pixie' to create a topographic, detailed map for the state they live in. In this mapping skills lesson, 4th graders use Pixie to make a map of their state that includes topographic features, state...
Curated OER
CHARTING THE COURSE
Students uses atlases, maps, and Web resources to determine the distance, driving time, and amount of money they need to make the trip (estimates should include hotel/motel stays, meals, and souvenirs).
Curated OER
Using Maps in the LCTL Classroom
Students review terms and prepositions of location and view a map to illustrate the meanings of the prepositions students are unfamiliar with. They play "Where am I?" game utilizing correct prepositions then they work with a partner to...
Curated OER
Virtual Field Trip
Are we there yet? Young trip planners learn about their state and plan a trip. They will select sites to see in three cities in their state, and record associated costs in a spreadsheet. While this was originally designed as a...
Polar Trec
Global Snow Cover Changes
Snow is actually translucent, reflecting light off its surface which creates its white appearance. Pairs or individuals access the given website and answer questions about snow cover. They analyze graphs and charts, examine data, and...


