Curated OER
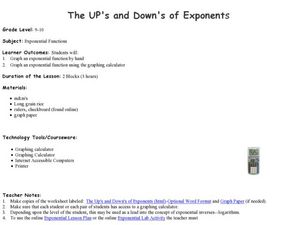
The UP's and Down's of Exponents
Students explore the concept of exponents. In this exponential functions worksheet, students complete provided worksheets that require them to graph exponential functions by hand as well using graphing calculators.
National Library of Medicine
Electricity, Frankenstein, and the Spark of Life
Shocking! After viewing a short clip from the 1931 movie, Frankenstein and reviewing electricity references in Mary Shelley's novel, class members examine Luigi Galvani's and Alessandro Volta's observations on electricity and muscle...
Curated OER
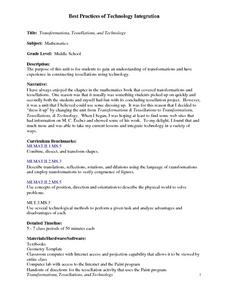
Transformations, Tessellations, and Technology
Middle schoolers complete a unit about transformations and tessellations. They explore various tessellation websites, determine which shapes tessellate, complete a log about which website activities they complete, and create a...
Alabama Learning Exchange
Flutter By, Butterfly!
Students examine the basic characteristics of butterflies. They view a butterfly PowerPoint presentation, complete various labelling activity sheets, explore websites, and design a poster that includes facts and illustrations to be used...
Curated OER
Balancing Equations
Students balance equations using the correct method. In this algebra instructional activity, students solve linear equations using a virtual balance beam as a manipulative. They play games to reinforce the concept of equations being and...
Curated OER
Every Vote Counts
Learners participate in an activity designed to increase student awareness and participation in the voting process.
Curated OER
Pythagorean Theorem
Eighth graders draw right triangles and identify the parts of a right triangle: right angle, interior and exterior angles, hypotenuse and legs. They predict and identify any relationships that exist between the sides of a right...
Curated OER
Migration of the Neo-Tropical Songbirds
Fifth graders plot the migration of birds using Google Earth. In this instructional activity on bird migration, 5th graders work in groups to plot the migration of a group of birds using Google Earth. Students present and discuss their...
Curated OER
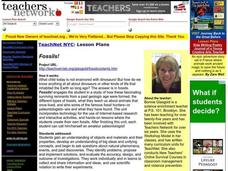
Fossils!
Students conduct Internet research about different types of fossils, the animals they are from, and some famous paleontologists. They also participate in some interactive activities and hands-on lessons in which they create their own...
Curated OER
It All Starts With a Seed
Students use laboratory equipment safely. They identify structures in a seed. They distinguish between monocots and dicots. They search for information using the computer.
Tech Museum of Innovation
Analogous Models
What goes into a museum display? A secondary-level STEM project prompts groups to design a museum display for the Tech Museum of Innovation. They create an analogous, interactive model illustrating a science concept to complete the...
Civil War Trust
Transcribing Civil War History
Primary sources are valuable for understanding the context of historical events, but the diction and dialect in these documents can be difficult to understand. Middle and high schoolers participation in a transcription process in which...
Missouri Department of Insurance
Health Insurance
Confused by how health insurance works? This informational pamphlet and worksheet from the Missouri Department of Insurance offers explanations and examples to help future adults make important decisions regarding health insurance.
Stratford Academy
Microsoft Word Exercise
Get to know the computer program, Microsoft Word, by completing 24 tasks, including typing a line of text, experimenting with format options, inserting page numbers, headers, footers, and more.
Curated OER
Natural Disaster Acrostic Poems
Fourth graders will conduct research to locate facts about natural disasters. Using a cross-curricular approach they will create acrostic poems with technology. The emphasis will be upon establishing skills for using powerpoint media.
Curated OER
Click! Writing Through Digital Photography
Students take their own digital photographs and scan them onto the computer. For each photograph, they write about them and use the internet to research their subject in the photo more throughly. They are graded based on a rubric and...
Curated OER
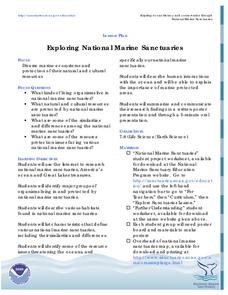
Exploring National Marine Sanctuaries
Students research marine ecosystems by creating class presentations. In this oceanography lesson, students research the different locations of marine sanctuaries by identifying them on a transparency map in class. Students...
Curated OER
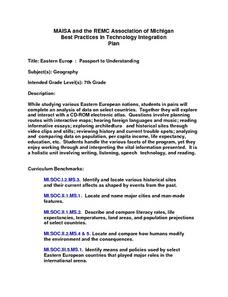
Eastern Europe: Passport to Understanding
Seventh graders explore Eastern Europe. They analyze data on select countries. Students prepare a short oral presentation on the country they researched. They locate their country using an interactive map.
Curated OER
Fod Pyramid
Sixth graders investigate the Food Pyramid and how it relates to their own diet. They conduct Internet research, complete the "Rate Your Plate" online activity, and create a HyperStudio presentation.
Curated OER
The Western Hemisphere on Review
Sixth graders research a country in the Western Hemisphere. They write a research paper and present a five-minute presentation on the country. They use PowerPoint to give their presentations to the class.
Curated OER
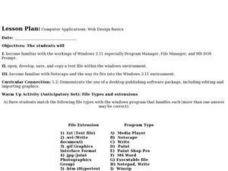
Computer Applications: Web Design Basics
Students become familiar with the workings of Windows 3.11 especially Program Manager, File Manager, and MS DOS Prompt. They open, develop, save, and copy a text file within the windows environment. They become familiar with Netscape and...
Curated OER
Survey Project
Eighth graders create a website using FrontPage. They use inserted forms to collect survey information and use Microsoft Excel and MS Word to create a presentation of the survey and the results.
Curated OER
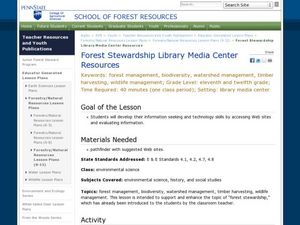
Forest Stewardship Library Media Center Resources
Students develop their technology skills by accessing web sites and evaluating information. In this research activity students research forestry topics and write a paragraph on the accessed websites.
Curated OER
Candy Colors: Figuring the Mean, Median, and Mode
Young scholars count candy by color and then calculate mean, median, and mode. They count candy and use the data to calculate mean, median, and mode (by color) and apply their learning to another collection of data.


