Curated OER
Health of Aquatic Life a Real Problem
Learners explore the health of aquatic life in this science lesson plan They measure and track the oxygen level in the water to determine the health of the aquatic life. They collect this data using the TI explorer to graph and analyze...
Curated OER
Land Erosion - Does Vegetation Matter?
Young learners explore erosion, deposition, weather and climate in this science lesson. They discuss the cause of erosion, collect data and analyze it suing the TI Explorer. They can also use the TI CBL or Vernier LabPro for this...
Texas Instruments
Land Erosion - Running Off With Soil
Learners evaluate the relationship between rainfall and runoff of a small island for one year. In this rainfall vs. runoff lesson, students analyze the relationship between the rainfall and the runoff on Barro Colorado Island over a...
Texas Instruments
How Do Pinnipeds Stay Warm?
Learners experiment to determine ways different types of insulation materials work. In this animal adaptation lesson plan, they make hand coverings from plastic bags, shortening, feathers, and wool. They observe effects of these...
Texas Instruments
Can You Breathe Like a Pinniped?
Young learners compare the breathing patterns of different animals in this pinniped lesson. They examine the breathing pattern of California sea lions and northern elephant seals. Pupils collect, compare and analyze data concerning...
Curated OER
Angling for Distance
Explore the concept of projectile distance through determining the angle that will provide the maximum distance of a launched projectile. Students launch baseballs on a football field and video tape the path of the ball.
Curated OER
Fundamental Topics in Science App
Pupilss explore science using technology in this lesson. They manipulate the TI to find important science topics. This activity requires a TI-84 or higher.
Curated OER
Graphing the Absolute Vaule Function
Learners investigate the graph of the absolute value function and the relationship between the parameters of the equation and the graph of the function.
Curated OER
FCAT Real World Solving Linear Equations/Systems
Pupils relate real life situation to the equations, graphs and inequalities. They model real life scenarios using matrices and draw conclusions from their data. This lesson plan is aligned with FCAT.
Curated OER
Augmented Matrices
Pupils write systems of equations in an augmented matrix and enter it into their calculator. They use the reduced row echelon function on the calculator to solve the system of equations.
Curated OER
Chill Out: How Hot Objects Cool
Teach how to explore exponential equations. In this Algebra II lesson plan, young scholars investigate the graph that occurs as a hot liquid cools. Students model the data algebraically.
Curated OER
Curve Fitting
Pupils investigate linear, quadratic, and exponential regressions. They plot sets of data points, determine the regression equation that best fits the data and lastly investigate the coefficient of determination.
Curated OER
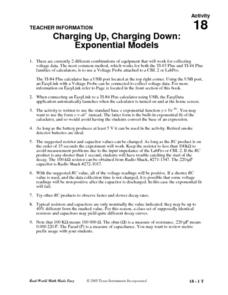
Charging Up, Charging Down
Learners collect and analyze voltage data. Then, they investigate exponential functions using the TI and a Voltage Probe and graph their data and analyze it using a table.
Texas Instruments
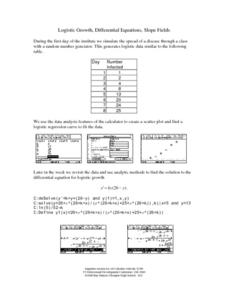
Logistic Growth, Differential Equations, Slope Fields
Investigate differential equations with your class. They use the TI-89 to explore differential equations analytically, graphically, and numerically as the examine the relationships between each of the three approaches.
Curated OER
Paying College Tuition
The investigation of exponential equation in the context of increasing college tuition costs is explored through this lessib. Students write exponential equations based on the percent of change of college tuition and use their equations...
Curated OER
NUMB3RS Activity: Exponential Growth
Mathematicians investigate exponential growth by exploring two different options for receiving allowance. Young scholars use technology to compare a linear function with a constant rate of growth to a function that grows exponentially...
Texas Instruments
Graphing Calculator Investigation Graphs of Relations
Learners investigate relations in this algebra lesson. They graph the set of ordered pairs that determine a relation. Using a TI-83 Plus, your learners will enter the coordinates in a list, create a scatter plot, and manipulate the...
Curated OER
Getting Started with the TI-Navigator™ System: What's My Line?
Learners analyze linear functions in this algebra instructional activity. They explore the meaning of slope and the slope-intercept form of a line as they investigate the effect changing parameters on the graph of a linear function.
Curated OER
Rational Numbers
Young scholars investigate rational numbers in this algebra lesson plan. They graph systems of equations and use technology to find the point of intersection. They need a TI for this assignment.
Curated OER
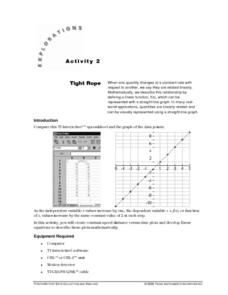
Tight Rope
Learn how to explore the concept of linear functions. In this linear functions lesson, young scholars collect linear data from a motion detector. Students walk to create a linear function. Young scholars plot the points on a graph and...
Curated OER
You Must Still Think Yourself, CAS Can Only Help
Have the class learn about and make conjectures about a line intersecting a cubic. In this making conjectures about a line intersecting a cubic lesson, students draw lines that intersect a cubic at three different points. Students...
Curated OER
NUMB3RS Activity: Settling The Score
Learn how to investigate matrix multiplication. In this secondary mathematics instructional activity, students examine matrix multiplication in the context of a Homes-Rahe stress test which is similar to the process used to score figure...
Curated OER
NUMB3RS - Season 3 - "Provenance" - Set the Trap
Learners investigate concept of matrices through iteration in this probability lesson. They investigate probability by creating a lesson based on a famous painting. This assignment contains extensions to the lesson.
Texas Instruments
Math TODAY for TI-Navigator System - Is Leisure Time Really Shrinking?
High schoolers organize data from the USA TODAY Snapshot, "Is leisure time really shrinking?" into two scatter plots and determine the quadratic model for each scatter plot. They determine if these graphs intersect and learn the concept...
Other popular searches
- Writing Advertisements
- Creating Advertisements
- Job Advertisements
- Print Advertisements
- Political Advertisements
- Product Advertisements
- Analyzing Advertisements
- Design Advertisements
- Classified Advertisements
- Magazine Advertisements
- Persuasive Advertisements
- How to Create Advertisements


