Curated OER
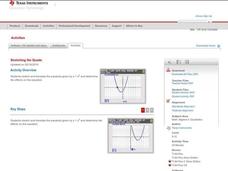
Stretching the Quads
Explore parabolas in this algebra lesson with the graphing calculator. The class investigates what effects the changing of the parameters of the vertex form of a quadrati have to its graph. They find the zeros of a quadratic graphically...
Curated OER
Application of Linear Systems
Let the learners take the driving wheel! The class solves systems of linear equations and applies the concepts of systems to solve a real-world situation about parking cars and buses. They then use calculators to create a visual of their...
Curated OER
Math TODAY - Breast Cancer Risks
Learners explore data that be modeled by a logistic function. They have the opportunity to study real-life data and create a mathematical function to model the data and make a prediction.
Texas Instruments
Classifying Functions
Learners explore linear, quadratic, and exponential functions in this activity that makes use of TI Navigator and TI Plus calculators. Using the technology, learners compare and contrast the three types of functions given in the activity.
Curated OER
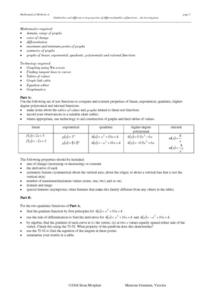
Similarities and Differences in Properties of Different Families of Functions - An Investigation
Exploring families of functions allows students compare and contrast properties of functions. Students discuss properties that include symmetry, max and min points, asymptotes, derivatives, etc.
Curated OER
Equations from Unit Rates
Your class can become linear equations masters, as they calculate the rate of change of a function. They observe different types of coordinates as they relate to a graph, then use the Ti-navigator to move the line around and draw...
Curated OER
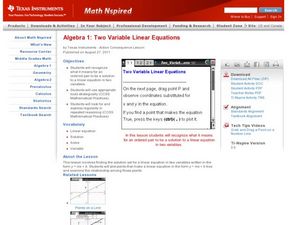
Two Variable Linear Equations
Everything you need to teach a lesson on two variable linear equations is right here. Objective, vocabulary, tech tips videos, and multiple downloadable files are all included. Learners will use the TI-Nspire technology to determine the...
Curated OER
Two-Variable Linear Inequalities
Here is an engaging instructional activity on solving equations with two variables. Have the class rewrite linear equations in the slope intercept form, y=mx + b. They graph the lines using the slope and y-intercepts.
Curated OER
Coming to Know F and C
Students collect temperatures using a probe and examine data. In this temperature lesson students complete an activity using a graphing calculator.
Curated OER
The King's Chessboard
Middle schoolers speculate on the better rate of pay: a dollar a day for 10 days, or a penny the first day, two pennies the second, doubling each day for 10 days. Start by listening to the story The King's Chessboard, by David Birch....
Curated OER
Graphs of the OTHER Trig Functions
Students graph trigonometric functions. In this precalculus lesson, students identify the properties of secant ,cosecant and cotangent. They use the unit circle as their formula to graph and analyze these functions.
Curated OER
Location of Resources in Early Civilizations
Sixth graders define scarcity and opportunity costs.
Curated OER
Exploring the Normal Curve Family
Students find different characteristics of the bell curve. In this statistics lesson, students analyze a family for a specific characteristic. They identify the shape, center, spread and area as they analyze the characteristic of the...
Curated OER
Systematics: Classifying Organisms
Students describe the techniques biologists use to classify organisms. In this biology lesson, students create cladograms and phylogenetic trees. They list the levels of taxonomic hierarchy.
Curated OER
Biodiversity and Ecosystems
Middle schoolers differentiate between biotic and abiotic factors in this science lesson plan. Learners collect data for the experiment and analyze the data after graphing it using the CBL 2. This experiment is split into two different...
Curated OER
The Disappearing Kelp Forest
Learners observe the effect "El Nino" left on kelp plants and sea urchins. They analyze the data collected by researchers, by graphing it on a TI calculator. Before graphing and analyzing the data, you may want to revisit the events of...
Curated OER
The Effect of Acid Rain on Limestone
Pupils investigate the pH of rain water in this earth science lesson. They collect rain water from their area and explore the pH when lime stone is added, then they will use the data collected to conjecture as to the effect of acid rain...
Curated OER
Hess's Law
Pupils solve chemical equations. In this chemistry lesson, they balance chemical equations after completing a lab. They can use a TI for this assignment.
Curated OER
Energy Content of Foods
Learners collect data, organize and analyze the data and compare it to real life scenarios. This assignment requires two class periods.
Curated OER
Lemon "Juice"
Middle schoolers explore the concept of electricity in this lesson as they measure the electricity that a lemon gives off. Learners use volt meters to measure the amount of electricity coming from the lemon. Your class will also measure...
Curated OER
Let the River Run
Pupils examine deposits found in a river in this science lesson plan. They collect data of sediment deposit found in the Mississippi river, then graph and analyze their data using the TI.
Texas Instruments
When pH Changes What Happens?
Learners explore the pH of water in this fourth through ninth grade science lesson. They test water samples to determine the pH, then record observations at the aquatic site and compare their observations with the pH readings.
Curated OER
Does Clear Water mean Healthy Water?
Learners test their local aquatic site to determine its water clarity. They collect a water sample and measure its turbidity using a sensor, then they repeat the experiment to obtain a second turbidity reading to find the average value.
Texas Instruments
Light and Day
Pupils explore the concept of collecting data as they collect data on their graphing calculator about time, temperature, and light. Learners plot the data and create histograms and box and whisker plots to analyze the data.
Other popular searches
- Food Advertising Marketing
- Marketing and Advertising
- Marketing Advertising
- Marketing Advertising Budget
- Marketing Advertising
- Sports Marketing Advertising


