Curated OER
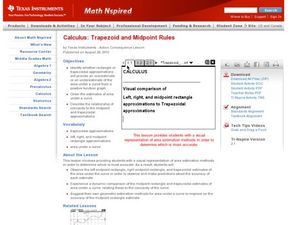
Trapezoid and Midpoint Rule
Students solve problems of area using the trapezoid and midpoint rule. In this calculus activity, students take the derivative of the functions as they approximate the area under a curve. They calculate the exact area using the area...
Curated OER
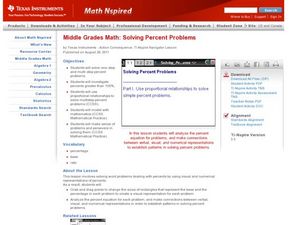
Solving Percents Problems
Students solve problems dealing with percents. In this algebra lesson, students convert between decimals and percents using factoring. They solve one step problems involving percents.
Curated OER
What's Your Story
Students rewrite word problems using equations. In this algebra lesson, students relate the concept of equations and symbols to the real world. They graph their solutions on a graph and analyze it.
Curated OER
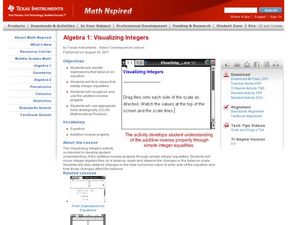
Visualizing Integers
Students create visuals on the TI Calculator to solve problems. In this algebra activity, students perform basic operations with integers. They add, subtract, multiply and divide.
Curated OER
Variables on Both Sides
Learners solve equations with variables on both sides of the equations. In this algebra lesson, students use addition, subtraction, multiplication and division to solve problems. They combine like terms and identify the unknown.
Curated OER
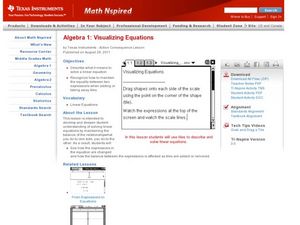
Visualiziing Equations
Students use visuals and words to solve equations. In this algebra lesson, students observe the necessary steps needed to add, subtract,multiply and divide to solve an equation. They graph their solution using the TI calculator.
Curated OER
Graphing Linear Equations
Students graph linear equations. In this algebra lesson, students perform transformation on linear equations. They identify the slope and y-intercept of each line.
Curated OER
What is a Solution to a System?
Pupils define the solution to a system of equation. In this algebra lesson, students graph two line on the TI calculator and identify the point of intersection if there is any. They find one, zero or infinitely many solution and explain...
Curated OER
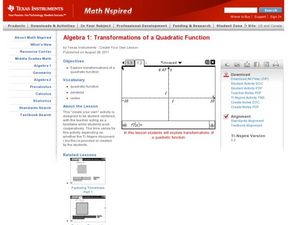
Transformations of a Quadratic Function
Learners graph quadratic functions. In this algebra lesson plan, students perform transformation on the TI calculator as they create a visual. They identify the vertex and intercepts of the parabola.
Curated OER
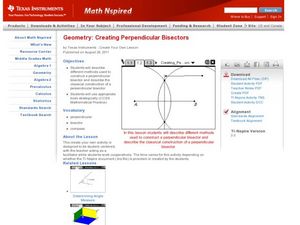
Creating Perpendicular Bisectors
Students create perpendicular bisectors. In this geometry lesson plan,students use a straight edge and protractor to create a perpendicular bisector. They graph line on the TI and analyze it.
Curated OER
Transformers
Students use transformation to move the graph around. In this geometry lesson plan, students observe transformation of symmetry groups. They use the TI to move the sides of the polygons around and make predictions.
Curated OER
End Behavior of Polynomial Functions
Students identify the end behavior of polynomial functions. In this algebra lesson, students graph different polynomials functions and find a correlation between exponents and function behavior. They identify the effect the leading...
Curated OER
Rational Functions
Students evaluate rational functions. In this precalculus lesson, students make observations and define what makes a rational function and what makes a linear function. They use the Ti calculator to visualize the different graphs.
Curated OER
Boxplots Introduction
Students describe the pattern of a bell curve graph. In this statistics lesson, students move data around and make observation about the mean, and the quartiles. They define boxplot, outlier, range and other important vocabulary words...
Curated OER
Multiply Boxplots
Students identify the mean, quartiles and range of a boxplot. In this statistics lesson, students identify cooperative boxplot as it relates to the data. They make conjectures about students grade distribution.
Curated OER
Transformations: Dilating Functions
Young scholars dilate functions using transformation. For this algebra lesson, students complete vertical dilation, stretch and shrink. They perform reflection across the x and y axis.
Curated OER
How to Make Histograms
Students collect data and plot it using a histogram. In this statistics lesson, students interpret histograms. They find the frequency, percents and density.
Curated OER
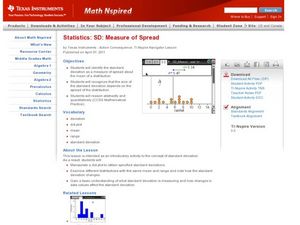
Measure of Spread
Students identify the standard deviation. In this statistics lesson, students find the mean distribution and calculate the percent of deviation from the mean. They observe this change on the Ti calculator.
Curated OER
Finding a Line of Best Fit
Pupils engage in the practice of creating a scatter plot with the data obtained from measuring different resting heart rates. The data is used to create the table that is translated into a graph. The lesson gives instructions for the use...
Curated OER
Velocity, Position, Distance
Students solve problems involving motion and distance. In this calculus lesson, students use to derivative to calculate the velocity-of a function. They observe objects moving along a straight line.
Curated OER
Applied Fundamental Theorem of Calculus
Young scholars apply the Fundamental Theorem of Calculus. In this calculus instructional activity, students identify the graphical connections between functions and accumulation functions. They use a TI to represent the functions.
Curated OER
Simple Harmonic Motion
Students solve problems involving graphs. In this calculus lesson, students relate harmonic motion to velocity. They discuss the derivative and the effect on the functions created.
Curated OER
Recipe: Unit Rate
Students solve problems using ratios and proportions. In this algebra lesson, students identify the unit rate and convert between fractions and decimals. They create graphs from their data.
Curated OER
Proportionality in Tables, Graphs, and Equations
Students create different methods to analyze their data. In this algebra lesson, students differentiate between proportion and non-proportional graph. They use the TI-Navigator to create the graphs and move them around to make their...
Other popular searches
- Food Advertising Marketing
- Marketing and Advertising
- Marketing Advertising
- Marketing Advertising Budget
- Marketing Advertising
- Sports Marketing Advertising


