Curated OER
Weather Chart
Students select at least 6 cities from around the world to keep track of their high and low temperatures over a period of time.
Curated OER
Physical Characteristics of the Troposphere
Students lexplore environmental trends in the troposphere- temperature, dew point, pressure and wind speed- by checking their hypotheses against data collected by weather balloons.
Curated OER
Can The Radon Problem Be Fixed?
Young scholars participate in lab activities in which they examine the radon level in homes. They demonstrate through convection currents how radon moves through a home based on temperature. They predict what they believe will occur...
Discovery Education
Sonar & Echolocation
A well-designed, comprehensive, and attractive slide show supports direct instruction on how sonar and echolocation work. Contained within the slides are links to interactive websites and instructions for using apps on a mobile device to...
Curated OER
Weather Watchers
Students identify basic weather instruments and how they are used to record weather data. Students define several vocabulary terms as stated in lesson. Students use basic instruments to record weather data in their area. Students use the...
Curated OER
DEW POINT
Fourth graders investigate conditions causing saturation and measure the dew point of the atmosphere performing simple experiments.
Nuffield Foundation
Measuring the Rate of Metabolism
Plant respiration can be a difficult concept for young biologists to grasp; with a hands-on lab, learners can collect and graph data, then calculate the metabolism rate for the plants they studied. If you do not have a respirometer,...
Wild BC
Weather Where We Live
Over a span of two weeks or more, mini meteorologists record weather-related measurements. What makes this particular resource different from others covering similar activities are the thorough details for the teacher and printables for...
Nuffield Foundation
Measuring Respiratory Quotient
How do scientists prove tiny living things respire? Young scientists build a respirometer and measure respiration rates in living creatures. By comparing the measurements of both plants and animals, they understand the similarities.
Curated OER
Weather instruments
Students explore weather instruments. In this weather instructional activity, students make rain gauges, anemometers, and barometers following the instructions given in the instructional activity. Students set up a weather station using...
Chicago Botanic Garden
Causes and Effects of Climate Change
It's time for your class to literally show what they know! Pupils illustrate what they learned about the causes and effects of climate change by filling out a graphic organizer to complete the 5-part series of lessons. They discuss them...
Curated OER
What Do I Wear Out Here?
First graders identify the components of a modular spacesuit. In this astronaut clothing instructional activity, 1st graders discuss the importance of appropriate clothing for working in space. Students define the term...
Curated OER
Reading Weather Maps
Fourth graders the symbols that are used on weather maps. They develop five day forecasts based on information they gather from weather maps in the newspaper and on the Internet.
Curated OER
Weather Predictions
Students record weather data and create a five day forecast. Students investigate the roles of meteorologists and identify symbols used on a weather map. After gathering weather data for a week, students will create a five day forecast...
Curated OER
What's The Weather?
Second graders record and summarize daily weather observations for a week in the form of a bar graph. They cut and glue a weather symbol for each day, record it on the graph, and answer discussion questions.
Curated OER
What's the Weather?
Second graders make daily weather observations, record them with appropriate stickers on a chart, and then summarize them at the end of the week in the form of a bar graph.
Curated OER
Weather Predictions
Students play the role of weather personalities by making five day forecasts based on data gathered from observations, weather instruments, and weather maps. Each day a small group makes a class forecast for the next day and reviews the...
Curated OER
Thunderstorms
Fourth graders investigate the attraction between two different charges to explain the concept of lightning in a thunderstorm.
Curated OER
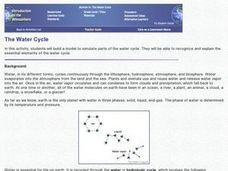
The Water Cycle--Model Simulation
Students build a model to simulate parts of the water cycle. They recognize and explain the essential elements of the water cycle.
Curated OER
Operation Weather Station
Learners work in cooperative groups to create a working weather station. Tkey use the weather station to collect weather data over a one-week period. Students compare the data from their weather station to actual weather information...
Curated OER
You Can Die Here
Students examine Death Valley including the amount of precipitation and winds that it gets. In this climate based lesson students explain the reasons for the amount of precipitation and windward patterns in Death Valley.
Office of the New Jersey State Climatologist
Play Ball! – Or Not…Making a Decision Using Weather Data
Should the game go on or not? An engaging instructional activity asks small groups to make a decision using weather data. After analyzing a map, an updated forecast, and radar information, groups have to decide whether to cancel a...
NASA
Making Oxygen and Carbon Dioxide
Some like it hot! Scholars observe both exothermic and endothermic reactions as part of the carbon dioxide oxygen cycle. First, scientists demonstrate (or watch) a chemical reaction to create pure oxygen using fire for...
Council for Economic Education
GDP Data: Is the Economy Healthy?
Does the economy needs a check-up? Scholars analyze the gross domestic product (GDP) to determine the overall health of the current economy. They use a short video clip as well as economic data to determine the current growth of the...


