Illustrative Mathematics
Medieval Archer
This activity presents a problem about a computer game which uses functions to simulate the path of an arrow fired by an archer. Learners use the given function to determine where the archer must stand in order to fire an arrow that will...
Illustrative Mathematics
Distance across the channel
Here you will find a model of a linear relationship between two quantities, the water depth of a channel and the distance across the channel at water level. The cross section of the channel is the shape of an isosceles trapezoid. The...
EngageNY
Lines That Pass Through Regions
Good things happen when algebra and geometry get together! Continue the exploration of coordinate geometry in the third lesson plan in the series. Pupils explore linear equations and describe the points of intersection with a given...
Illustrative Mathematics
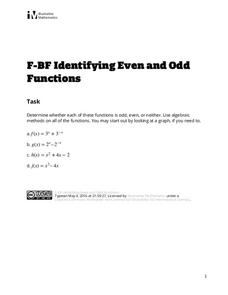
Identifying Even and Odd Functions
Is it even ... or odd? The task provides four functions to identify as being even, odd, or neither. Pupils use algebraic methods to make their decisions with select exponential, quadratic, and cubic functions.
Curated OER
Hyperbolas: Sketching from the Equation
In this algebra worksheet, students sketch graphs of hyperbolas after solving equations to standard form and interpreting the center, vertices, foci, axis, asymptotes, and eccentricity from the equation. There are 58 questions.
Illustrative Mathematics
Find the Change
This exercise is an opportunity for algebra learners to understand the connection between the slope of a line and points found on the line. Use similar triangles to explain why slope m is the same between any two points. Discuss with the...
West Contra Costa Unified School District
The Extreme Value Theorem
Finding the critical numbers of a function can be extreme. The lesson introduces the Extreme Value Theorem to the class with a graph. Pupils then have an opportunity to practice determining the values using an algebraic function.
Willow Tree
Linear Relationships
There's just something special about lines in algebra. Introduce your classes to linear equations by analyzing the linear relationship. Young mathematicians use input/output pairs to determine the slope and the slope-intercept formula to...
Curated OER
TI Calculator
For this algebra worksheet, 11th graders troubleshoot the TI-83/84 graphing calculator. They review the proper process to use when entering equations and fractions into the calculator. There are 4 example problems worked out.
Mathematics Assessment Project
Funsize Cans
Designing fun-size cans ... what fun! Class members use the provided questions to determine the dimensions of a can with a minimum surface area for a given volume. The task allows learners to use graphs or algebraic manipulation to...
Curated OER
Transforming Parabolas
In this Algebra II worksheet, 11th graders examine the affects of changing h and k in the vertex form of the parabola. The three page worksheet provides explanation of topic, worked examples, and four practice problems. ...
Curated OER
Systems of Linear Inequalities
In this Algebra I/Algebra II learning exercise, students solve systems of linear inequalities by graphing the inequalities on a coordinate plane and determining the location of all ordered pairs that solve the system. The three...
Curated OER
Functions
In this Algebra I/Algebra II instructional activity, students evaluate functions. Students graphs functions and determine the domain and range, find the sum, difference, and product of functions, find composite functions and explore...
Curated OER
Inequalities are Everywhere
For this Algebra I worksheet, 9th graders work with a family member to graph inequalities on a number line. The two page worksheet contains five questions. Answers are included.
Curated OER
Summer 1999, MA 123: Cumulative Review
In this math worksheet, students work to complete the review for a final part of an Algebra II class. The sheet has review problems.
Kuta Software
Properties of Complex Numbers
In this worksheet, students evaluate complex (signed and imaginary) numbers. In addition, they are asked to graph complex numbers as well as identify a complex number on a presented graph.
Curated OER
Properties of a Parabola
For this algebra worksheet, students identify the properties of a parabola. They factor and graph quadratic equations. There are 18 questions.
Curated OER
Pairs of Lines Multiple Choice
In this algebra worksheet, students identify the slope and y intercept of lines. They compare the slope of perpendicular and parallel lines and find the missing slope. There are 6 questions with an answer key.
Curated OER
Inverse Reciprocals Quiz
In this algebra activity, students determine the inverse and reciprocal for 6 problems using a table and a graph.
Curated OER
Linear Systems and Quadratics
In this algebra instructional activity, students solve quadratic equations and linear equations. They graph their points and identify where the 2 intersect. There are 10 questions with an answer key.
Curated OER
Solving Open Sentences Involving Absolute Value
In this math worksheet, students solve 6 open sentences and graph solutions using a line graph. Students then express 2 story problems in terms of inequalities. Students then write open sentences for 2 graphs.
Curated OER
The Algebra and Geometry of Inverse Functions
In this inverse functions worksheet, students read a tutorial and complete fourteen fill in the blank style practice problems. Students read a tutorial about the composition of functions. They answer three fill in the blank questions...
Curated OER
Math Regents Exam Questions: Lesson 1-6 - Mean, Median, Mode and Range
In this mean and median worksheet, students examine given data and determine the measures of central tendency for the data. Students compute the mode, mean, median, and range of data. They create stem-and-leaf plots. ...
Curated OER
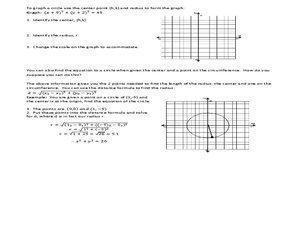
Algebra II - Lesson 10-3: Circles
In this equations of circles instructional activity, students solve 4 short answer problems. Students find an equation of a circle given the center and radius.


