EngageNY
Are All Parabolas Similar?
Congruence and similarity apply to functions as well as polygons. Learners examine the effects of transformations on the shape of parabolas. They determine the transformation(s) that produce similar and congruent functions.
EngageNY
Factoring Extended to the Complex Realm
A solution will work one way or another: find solutions, or use solutions to find the function. Learners use polynomial identities to factor polynomials with complex solutions. They then use solutions and the Zero Product Property to...
Inside Mathematics
Quadratic (2006)
Most problems can be solved using more than one method. A worksheet includes just nine questions but many more ways to solve each. Scholars must graph, solve, and justify quadratic problems.
Mathematics Assessment Project
Generalizing Patterns: Table Tiles
As part of a study of geometric patterns, scholars complete an assessment task determining the number of tiles needed to cover a tabletop. They then evaluate provided sample responses to see different ways to solve the same...
Balanced Assessment
Local and Global Behavior
Create rules for numerical sequences. Pupils develop local rules and recursive rules for number sequences. The sequences are linear, quadratic, and cubic in nature. Scholars find that some local rules do not work, no matter where in...
Curated OER
Interpreting Graphs
Sixth graders interpret linear and nonlinear graphs. They create graphs based on a problem set. Next, they represent quantitive relationships on a graph and write a story related to graphing.
West Contra Costa Unified School District
Multiple Representations of Equations
class members first work through finding the equation, table of values, graph, and key features of a linear function expressed verbally. Individuals then work through several more problems given different representations.
Mathematics Vision Project
Module 1: Sequences
Take steps into sequences. An 11-lesson unit builds upon pupils' previous understanding of writing expressions to develop the idea of sequences. The resource explores both arithmetic and geometric sequences using recursive and explicit...
West Contra Costa Unified School District
Investigating the Discriminant
When is finding the discriminant enough? Using the quadratic formula helps find solutions to quadratic equations, but there are times when just using the discriminant is appropriate. Use this algebra II lesson plan to help classes...
Fall River Schools
Parabolas Are All Around Us
Moving parabolas off of graph paper and into the real world is the task at hand in this detailed poster project. First, learners perform a cumulative activity identifying many characteristics of an assigned quadratic equation. Next, they...
Curated OER
Why Are Hot Things Red?
In this radiation and temperature worksheet, learners use 2 methods to derive the Wein Displacement law that shows the relationship between the temperature of a body to the frequency where the Planck curve's value is at its maximum....
Curated OER
Be Direct - Oil Spills on Land
Students participate in an activity to simulate direct variation. In this oil spills on land lesson plan, students participate in a simulation using toilet paper and vegetable oil to explore the characteristics of direct variation. They...
Curated OER
Trigonometry and the Calculator
For this geometry worksheet, 10th graders use a graphing calculator to evaluate trigonometric functions and their inverses. The four page worksheet contains explanation, examples, and twenty questions. Answers are not...
Curated OER
Geometric Sequences and Series
Learn to calculate the nth term of a sequence defined by an algebraic expression. They examine geometric sequences and series, relate geometric sequences to their explicit forms, find the partial sums of a sequence in a table, and...
Curated OER
Graphing Logarithms
In this logarithms worksheet, students identify the domain and range of given logarithms. They sketch the graph on a coordinate plane. This four-page worksheet contains 12 multi-step problems. Answers are provided on the last two pages.
Curated OER
Make a Pass at Me
Learners identify different types of functions and units of measurements. In this statistics lesson plan, students will collect data, graph their data and make predictions about their data. They plot a linear regression graph.
Curated OER
Slopes and Linear Equations
Young scholars find the slopes of linear functions. In this graphing lesson, students analyze linear equations and calculate the slope of the line. They graph a line given the slope and y-intercept.
Curated OER
EOC Review G
For this end of course review, students factor expressions, interpret statistic problems, and identify the maximum and minimum of equations. This two-page worksheet contains 5 multi-step problems.
Curated OER
Exponential and Logarithmic Equations
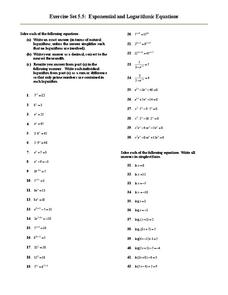
In this algebra worksheet, 11th graders solve exponential and logarithmic functions using properties of exponents and logs. There are 56 questions with an answer key.
Curated OER
Points of Intersection
Eighth and ninth graders solve five different problems that include solving two equations. They determine the point of intersection in each of the five pairs of equations given. Pupils define point of intersection as the point where two...
Curated OER
Optimization For Breakfast
Students identify he proportion of a cereal box. In this algebra lesson, students define the relationship between patterns, functions and relations. They model their understanding using the cereal box.
Curated OER
The Box Problem
Students create graphic, algebraic and verbal ideas of functions. In this algebra lesson, students graph functions and identify the zeros of the functions. They find the domain and range and classify functions as relation or not.
Curated OER
Square-Root Functions and Radical Equations
This practice worksheet includes simple radical equations, and some quadratic equations that can be solved by the square root method. There is good practice here in checking the solutions, and a few graphing problems.
Curated OER
Quadratic Formula
Mathematicians determine the solutions of a quadratic function by looking at a graph. They use the quadratic formula to solve quadratic functions on their Ti-Nspire.


