Teach Engineering
Using Hooke's Law to Understand Materials
Provide a Hooke for a lesson on elasticity with an activity that has groups investigate a set of springs. They use a set procedure to collect data to calculate the spring constant for each spring using Hooke's Law. The groups...
Curated OER
Mirror Curvature
Students investigate parabolas as the shape of a telescopic mirror. In this Algebra I/Algebra II lesson, students explore the relationship between the coefficients of a quadratic function and the shape and position of the parabolic...
Curated OER
SkyHighScrapers
Students investigate quadratic functions. In this Algebra I/Algebra II lesson, students determine the equation of a quadratic function that closely matches a set of points. Students investigate the necessary information that...
Curated OER
Plugging Into The Best Price
Examine data and graph solutions on a coordinate plane with this algebra lesson. Young problem-solvers identify the effect of the slope on the steepness of the line. They use the TI to graph and analyze linear equations.
Texas Instruments
A Tale of Two Lines
Students graph systems of equation. In this calculus lesson, students graph their lines on a TI calculator. They identify the point of intersection and the type of solution.
Virginia Department of Education
Factoring for Zeros
Relate factors to zeros and x-intercepts. Scholars first graph quadratics in both standard and factored forms to see that they are the same. They go on to use the graphs to see the relationship between factors and x-intercepts.
Virginia Department of Education
The Submarine
Submerge yourself in the study of slope. Scholars investigate a situation involving slope and the rate of change of a submarine. An additional example further explores the concept of slope by changing one of the conditions of the submarine.
Curated OER
Binomial Expansion
In this algebra worksheet, students expand binomials and identify different terms. They expand the function using the binomial theorem. There are forty-four questions with an answer key.
Curated OER
Addends with Spiffy
Students solve single variable equations. In this missing addend lesson, students solve problems with missing addends. Students create a function box to help study numerical reasoning.
Curated OER
How are we Related?
Students differentiate functions based on their domain and range. In this algebra lesson, students define function, domain, range and relation. They analyze graphs and coordinate pairs for input and output values making up a function.
Curated OER
Translating Graphs of Trig Functions
Students use degrees and compute the amplitude and period of twelve functions. They graph each function on an included coordinate grid.
Curated OER
Linear-Quadratic Inequalities
High schoolers graph linear and quadratic functions. In this algebra lesson, students create graph with specific coordinate points. They use the Ti to visualise and differentiate between the two functions.
Curated OER
Transforming Parabolas
In this Algebra II worksheet, 11th graders examine the affects of changing h and k in the vertex form of the parabola. The three page worksheet provides explanation of topic, worked examples, and four practice problems. ...
Curated OER
Quadratic Formula
Students factor and solve quadratic equations.In this algebra lesson, students identify the roots of an equation using the quadratic formula. They graph and identify the properties of a parabola.
Curated OER
MT-A141 PreCalculus: Worksheet 5.1
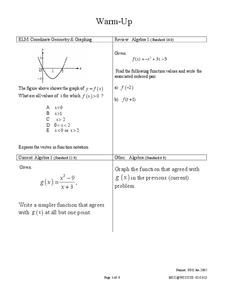
In this precalculus worksheet, students evaluate and graph given functions. They identify the domain and asymptote of each equation. There are two multi-step problems to this worksheet.
West Contra Costa Unified School District
Derivative – Standard Definition
Making a clear connection to algebra concepts helps learners understand the definition of a derivative. The lesson begins with looking at limits of simple linear and rational functions, and leads to the definition of the...
EngageNY
Newton’s Law of Cooling, Revisited
Does Newton's Law of Cooling have anything to do with apples? Scholars apply Newton's Law of Cooling to solve problems in the 29th installment of a 35-part module. Now that they have knowledge of logarithms, they can determine the decay...
EngageNY
Complex Numbers and Transformations
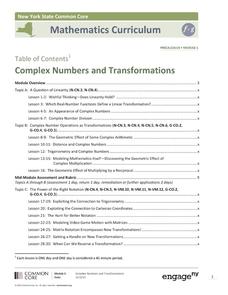
Your learners combine their knowledge of real and imaginary numbers and matrices in an activity containing thirty lessons, two assessments (mid-module and end module), and their corresponding rubrics. Centered on complex numbers and...
National Security Agency
Multiple Representations of Limits
After an introductory activity to demonstrate the theory of a limit, additional activities approach a limit from graphical, numerical, and algebraic methods. The activity looks at the multiple ways of understanding and evaluating a...
Inside Mathematics
Coffee
There are many ways to correlate coffee to life, but in this case a worksheet looks at the price of two different sizes of coffee. It requires interpreting a graph with two unknown variables, in this case the price, and solving for...
EngageNY
Modeling from a Sequence
Building upon previous knowledge of sequences, collaborative pairs analyze sequences to determine the type and to make predictions of future terms. The exercises build through arithmetic and geometric sequences before introducing...
EngageNY
Modeling an Invasive Species Population
Context makes everything better! Groups use real data to create models and make predictions. Classmates compare an exponential model to a linear model, then consider the real-life implications.
Inside Mathematics
Graphs (2006)
When told to describe a line, do your pupils list its color, length, and which side is high or low? Use a learning exercise that engages scholars to properly label line graphs. It then requests two applied reasoning answers.
Curated OER
As the Wheel Turns
This is not your typical Ferris wheel problem. In this exercise, your class will combine their knowledge of sinusoidal functions as well as linear motion to come up with parametric equations that model the position of a point on the edge...


