EngageNY
Wishful Thinking—Does Linearity Hold? (Part 1)
Not all linear functions are linear transformations — show your class the difference. The first lesson in a unit on linear transformations and complex numbers that spans 32 segments introduces the concept of linear transformations and...
Curated OER
Function Tables
In this function tables worksheet, 11th graders solve 10 different problems that include completing various function tables. First, they read and identify each rule given for the tables. Then, students use the rule to determine the input...
Curated OER
Inverse Functions
In this inverse functions worksheet, 9th graders solve and graph 10 different problems that include the inverse of various functions. First, they determine if the coordinates given is the inverse of a function given. Then, students use...
Curated OER
Mystery Liquids: Linear Function
High schoolers determine the linear equations of the density of water and oil by collecting data on the mass of various volumes of each liquid. They construct scatter plots from the data and use these to write the linear equations for...
EngageNY
The Height and Co-Height Functions of a Ferris Wheel
Show learners the power of mathematics as they model real-life designs. Pupils graph a periodic function by comparing the degree of rotation to the height of a ferris wheel.
West Contra Costa Unified School District
Comparing Rational Functions and Simplified Functions
What kind of functions have holes in their graphs? Here, the teacher guides the class on how to use the simplified function of a rational function to aid in the graphing of the original rational function. T-tables are used in order...
EngageNY
End-of-Module Assessment Task - Algebra 1 (Module 3)
Looking for higher-level thinking questions? This assessment provides questions that challenge young mathematicians to think and analyze rather than simply memorize. Topics include piecewise functions, linear modeling, exponential...
EngageNY
Graphing the Sine and Cosine Functions
Doing is more effective than watching. Learners use spaghetti to discover the relationship between the unit circle and the graph of the sine and cosine functions. As they measure lengths on the unit circle and transfer them to a...
EngageNY
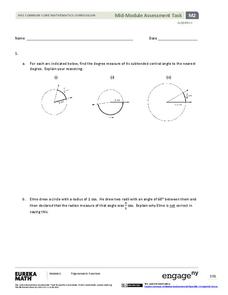
Algebra II Module 2: Mid-Module Assessment
Time for classes to show what they've learned. Use several tasks to assess understanding of the trigonometric functions, unit circle, radians, and basic trigonometric identities.
EngageNY
Modeling Riverbeds with Polynomials (part 2)
Examine the power of technology while modeling with polynomial functions. Using the website wolfram alpha, learners develop a polynomial function to model the shape of a riverbed. Ultimately, they determine the flow rate through the river.
EngageNY
Irrational Exponents—What are 2^√2 and 2^π?
Extend the concept of exponents to irrational numbers. In the fifth installment of a 35-part module, individuals use calculators and rational exponents to estimate the values of 2^(sqrt(2)) and 2^(pi). The final goal is to show that the...
West Contra Costa Unified School District
Writing Exponential Functions Based on Data
Give your class a concrete example of exponential growth and decay using this hands-on activity. These Algebra II lessons allow for the exploration of exponential growth and decay models, as well as the discovery of the patterns of...
EngageNY
Mid-Module Assessment Task - Algebra 1 (Module 3)
Having trouble finding performance task questions? Here is an assessment that uses all high-level thinking questions. It includes questions to assess sequences, linear functions, exponential functions, and increasing/decreasing intervals.
EngageNY
The Graph of the Natural Logarithm Function
If two is company and three's a crowd, then what's e? Scholars observe how changes in the base affect the graph of a logarithmic function. They then graph the natural logarithm function and learn that all logarithmic functions can be...
EngageNY
Representing, Naming, and Evaluating Functions (Part 1)
Begin the discussion of domain and range using something familiar. Before introducing numbers, the lesson uses words to explore the idea of input and outputs and addresses the concept of a function along with domain and range.
EngageNY
Modeling with Polynomials—An Introduction (part 2)
Linear, quadratic, and now cubic functions can model real-life patterns. High schoolers create cubic regression equations to model different scenarios. They then use the regression equations to make predictions.
EngageNY
Ferris Wheels—Using Trigonometric Functions to Model Cyclical Behavior
Have class members going in circles as they model the path of a Ferris Wheel using trigonometric functions. Building on the previous lesson in this series on transformations, learners use trigonometric functions to model wheels of...
EngageNY
Modeling with Exponential Functions
These aren't models made of clay. Young mathematicians model given population data using exponential functions. They consider different models and choose the best one.
EngageNY
Properties of Trigonometric Functions
Given a value of one trigonometric function, it is easy to determine others. Learners use the periodicity of trigonometric functions to develop properties. After studying the graphs of sine, cosine, and tangent, the lesson connects...
EngageNY
Linear and Nonlinear Expressions in x
Linear or not linear — that is the question. The lesson plan has class members translate descriptions into algebraic expressions. They take the written expressions and determine whether they are linear or nonlinear based upon the...
West Contra Costa Unified School District
Comparing Linear and Quadratic Functions
If a linear function and a quadratic function enter a boxing match, which one would win? Learners first review how to find key features of linear and quadratic functions. Next, they compare key features of pairs of functions.
Flipped Math
Calculus AB/BC - The Fundamental Theorem of Calculus and Accumulation Functions
Connect integrals with differentiation. The beginning of the video introduces the definition of an accumulation function. Scholars learn about the relationship between integrals and derivatives. Using what is commonly known as Part Two...
Pearson
End of Year Practice Test (Algebra I)
This complete multiple choice and short answer practice end-of-year test for algebra 1 offers a wealth of opportunities for customization. Offer it as a whole, to track progress or prepare the class for the format of the test, or...
Curated OER
Graphs and Functions
Use this series of activities to introduce learners to graphing functions. They graph both linear and quadratic equations by hand and with a Graph Sketcher Tool. Several imbedded links and handouts are included in the lesson.


