Illustrative Mathematics
Cell Phone Plans
Turn your classroom into a local cell phone store. Then, have your cell phone agents use linear equations to visually display three cell plans and their advantages. It makes for a great group project. Discuss how to decide which plan is...
Curated OER
Functions and the Vertical Line Test
Students explore the concept of functions. In this function lesson, students determine if the graph is a function by using the vertical line test. Students use an applet to explore the vertical line test on a variety of graphs.
Curated OER
Describing Patterns
Fourth graders investigate repeating and growing patterns. Models, graphs and words are used to describe, extend and represent patterns. Students use evidence from models and graphs to support the identification of patterns.
Curated OER
More Complicated Functions: Introduction to Linear Functions
High schoolers explore the concept of linear functions. In this linear functions lesson, students translate linear functions from tables to graphs to equations. High schoolers use an applet to write a function rule for a linear...
Curated OER
Will There be Enough Water?
Learners investigate water usage, water available, and water demand historically in the local area. They use projections of water usage, availability and demand up to the year 2050. Students use graphs to relate as well as compare and...
Curated OER
Water - Planning for the Future
Students explore and examine the increases and/or decreases for water user groups: irrigation, municipal, manufacturing, steam electric power generation cooling, livestock, and mining. They utilize percentage changes during their...
Curated OER
Introduction to Inverse Functions
Students investigate patterns of inverse functions. In this algebra instructional activity, students represent functions with the calculator and on paper. They analyze their data and draw conclusions.
Curated OER
What's Poppin'?
Second graders determine and compare weights and volumes of popped and unpopped corn to make predictions and solve problems. Students combine the data of each group into a graph. They construct questions, statements and story problems...
Curated OER
Graphs and Functions
Students are introduced to plotting functions on the Cartesian coordinate plane seen several categories of functions, including lines and parabolas
Curated OER
Algebra I: A Draining Swimming Pool
Students analyze and develop symbolic representations to describe the amount of water left in a pool being pumped out after a given amount of time, with various pumping rates and initial quantities of water in the pool.
Curated OER
Point-Slope Form
Ninth graders explore the point-slope form of linear equations and graph lines in the point-slope form. After completing the point-slope equation, they identify the slope of a line through a particular point. Students explain the...
Curated OER
Word Problems
Students solve word problems using mathematical symbols. In this algebra lesson, students collect data and analyze it. They analyze the data using a table or graph after plotting the data.
Curated OER
Who is Being Left Behind?
Students investigate scores as they relate to race. In this algebra lesson, students analyze standardized scores and how race can affect these scores. They plot their findings on a graph and draw conclusions.
Curated OER
Can you Find the Expression
Students collect data from measurements and weights for this experiment. In this algebra lesson, students analyze graphs they create form their data to find the expression representing the data. They label which graph provided the best...
Curated OER
Systems of Two Equations
For this systems of equations worksheet, students solve and complete 23 various types of problems. First, they solve each system of equations by graphing on the grids provided. Then, students solve each system by substitution and...
Curated OER
Using Tiles to Solve Word Problems
Young scholars solve problems using equations. In this algebra lesson plan, students identify the correct symbols and steps when solving word problems. They graph their lines and analyze the slope using tiles.
Curated OER
Equations, Expressions, Factorization
Learners graph and solve equations and expressions. In this algebra lesson, students use simple factorization to simplify expressions. They review for an exam by doing basic algebra.
Curated OER
It's a Drag!
Pupils create number lines using decimals and whole numbers. In this algebra lesson, students graph and solve linear equations. They plot ordered pairs on a coordinate plane correctly.
Curated OER
Linear Functions
Students solve, identify and define linear equations. In this algebra lesson plan, students calculate the slope and y-intercept of a line. They graph the line given two points and the slope.
Curated OER
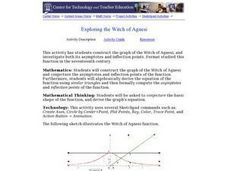
Exploring the Witch of Agnesi
students construct the graph of the Witch of Agnesi, and investigate both its asymptotes and inflection points. They construct the graph of the Witch of Agnesi and conjecture the asymptotes and inflection points of the function. ...
Curated OER
Introduction to Fractals: Infinity, Self-Similarity and Recursion
Students think about several of the concepts from fractals, including recursion and self similarity. They use mathematical concepts of line segments, perimeter, area and infinity are used, and skill at pattern recognition is practiced.
Curated OER
Putting Your Best Foot Forward
Third graders measure their feet and their parents' feet, record data on computer-generated graphs, and calculate and record mean, median, and mode.
Curated OER
Approximating Pi
Young scholars approximate Pi using the lower and upper bound for the constant. In this algebra lesson, students work in groups of two to graph a circle and approximate Pi using the circumference. They repeat their estimation until they...
Curated OER
Systems of Equations
Students solve systems of equations. In this algebra activity, students use elimination and substitution to solve for the point of intersection. They use graphing to see where the two lines intersect.


