Mathematics Assessment Project
Designing 3d Products: Candy Cartons
Wouldn't it be great to work in a candy factory? Learners get their chance as they first design a carton for a candy that meets certain requirements. They then examine and analyze nets and explanations in sample student responses.
Mathematics Assessment Project
Maximizing Profits: Selling Boomerangs
You'll return to this resource again .. .and again ... and again. Class members determine the maximum profit of a boomerang-making business by solving a system of equations. They then review and analyze provided sample responses to the...
Mathematics Assessment Project
Solving Quadratic Equations
Scholars first complete an individual assignment using a quadratic equation to model the movement of a bus around a corner. Learners then discuss their solutions with classmates and analyze the provided sample responses.
Discovery Education
Jets in Flight
This Discovery Education activity provides the information needed to understand the basics of flight. Before taking off, young pilots learn the eight stages of the engineering design process. Small groups then design and build an...
EngageNY
Tides, Sound Waves, and Stock Markets
Help pupils see the world through the eyes of a mathematician. As they examine tide patterns, sound waves, and stock market patterns using trigonometric functions, learners create scatter plots and write best-fit functions.
EngageNY
Calculating Conditional Probabilities and Evaluating Independence Using Two-Way Tables (part 2)
Without data, all you are is another person with an opinion. Show learners the power of statistics and probability in making conclusions and predictions. Using two-way frequency tables, learners determine independence by analyzing...
NOAA
Ground-truthing Satellite Imagery with Drifting Buoy Data
Ground-truthing ... is it even a word? The last installment of a five-part series analyzes how scientists collect sea surface temperature data. Scholars use government websites to compare temperature data collected directly from buoys...
It's About Time
Petroleum and Your Community
I was going to write a joke about oil, but it seemed crude. This lesson starts with a comparison of where the US gets oil from and how that has changed over time. After analyzing the data, scholars create a graph and use the Internet to...
It's About Time
Coal and Your Community
When I was young, I was afraid of the dark. Now I am afraid of getting the electric bill. This fourth lesson in a series of eight focuses on coal mining, conservation, and energy efficiency. Scholars start by taking data from a table and...
Balanced Assessment
How Big is Big?
Now you can create your own monster movie. Learners estimate the size of a scale model monster given comparison statements and analyze these estimates to determine if the scale model accurately portrays a lizard.
Statistics Education Web
Double Stuffed?
True or false — Double Stuf Oreos always contain twice as much cream as regular Oreos. Scholars first measure the masses of the filling in regular Oreos and Double Stuf Oreos to generate a class set of data. They use hypothesis testing...
EngageNY
Revisiting the Graphs of the Trigonometric Functions
Use the graphs of the trigonometric functions to set the stage to inverse functions. The lesson plan reviews the graphs of the basic trigonometric functions and their transformations. Pupils use their knowledge of graphing functions to...
University of Colorado
The Moons of Jupiter
Middle schoolers analyze given data on density and diameter of objects in space by graphing the data and then discussing their findings. This ninth installment of a 22-part series emphasizes the Galilean moons as compared to other objects.
University of Colorado
Are All Asteroids' Surfaces the Same Age?
There are more than 600,000 asteroids in our solar system. Pupils analyze images of two asteroids in order to determine if they are the same age. They count craters for each asteroid and compare numbers.
University of Colorado
Using Spectral Data to Explore Saturn and Titan
Saturn's rings are made of dust, ice, and solid chunks of material. Individuals use spectrographs in this final installment of 22 lessons to determine the atmospheric elements. They analyze spectrums from Titan's atmosphere and Saturn's...
Balanced Assessment
MasterMind
Knowledge of statistics and probability can increase your advantage when playing games. The activity asks learners to analyze the game of MasterMind to determine the number of possible codes. They also examine different variations of the...
NPR
Suffrage Lesson Plan
Has life changed for American women in the last century, or are there common themes between the lives of 21st century women and the struggle of suffragettes from the 1910s? Explore the ways media reflects the position of women in the...
Mathematics Common Core Toolbox
Golf Balls in Water
Here's a resource that models rising water levels with a linear function. The task contains three parts about the level of water in a cylinder in relationship to the number of golf balls placed in it. Class members analyze the data and...
National Institute of Open Schooling
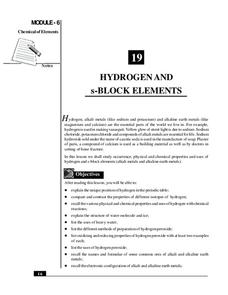
Hydrogen and s-Block Elements
Lesson 19 in the series of 36 analyzes the element hydrogen and the s-block elements. Through readings, answering questions, and discussion, learners write about and explain their occurrence, physical and chemical properties, and uses.
Intel
Track the Trends
Allow your classes to research what interests them. An engaging STEM lesson, the fourth in the series of six, asks individuals to choose a topic of interest and analyze the data through regression models. The regression equations allow...
Chicago Botanic Garden
Plant Phenology Data Analysis
Scientists monitor seasonal changes in plants to better understand their responses to climate change, in turn allowing them to make predictions regarding the future. The last activity in the series of six has scholars analyze BudBurst...
Noyce Foundation
Through the Grapevine
Teach statistics by analyzing raisins. A thorough activity provides lesson resources for five levels to include all grades. Younger pupils work on counting and estimation, mid-level learners build on their understanding of the measures...
American Battle Monuments Commission
The Strategic Bombing Campaign
An extensive look at World War II details the strategic bombing campaign of the Allied forces. Beginning in September 1939 and ending in May 1945, the interactive map follows British and American forces throughout the bombing campaigns...
Centers for Ocean Sciences
Ocean and Great Lakes Literacy: Principle 7
Your mission, should you choose to accept it, is to take your class on an underwater adventure. The final installment in a seven-part series involving salt and freshwater bodies takes junior oceanographers below the surface in...
Other popular searches
- Analyze Setting Literature
- Analyze Setting Conflict
- Analyze Setting Theme
- Analyze Setting in Fiction


