Cornell University
Math Is Malleable?
Learn about polymers while playing with shrinky dinks. Young scholars create a shrinky dink design, bake it, and then record the area, volume, and thickness over time. They model the data using a graph and highlight the key features of...
West Virginia Department of Education
An Act Worthy of Reward
John Brown is considered by many to be a martyr for abolition and civil rights. The resource covers an important event in West Virginian history, the raid by John Brown, as a standalone that discusses Brown's last words and his reaction...
Curated OER
Discovering Pi
Define terminology related to a circle. Practice accuracy in measuring and then create a spreadsheet based on data collected from solving for parts of a circle. Groups can have fun analyzing their data as it relates to Pi.
Prestwick House
New (March 2016) SAT Reading Test Practice
The SAT. The ACT. AP exams. The very mention of these exams can cause the college bound to feel anxious. One way to combat Test Anxiety is to provide high schoolers with models of these tests and give them opportunities to analyze the...
Curated OER
Mathematics: Best Salary
Sixth graders pretend to need jobs to earn money for a go-cart which costs $1,000. They predict which of two scenarios raise the money first. they construct charts and graphs to demonstrate their predictions.
Curated OER
That Was Then, This Is Now
Students examine the price of food over time. They analyze charts, perform math operations and compare and contrast data about the price of food. They complete worksheets while interperting the charts.
Curated OER
When Am I Ever Going to Use this?
Young scholars solve problems using equations and properties of integers. In this algebra lesson, students solve problems using ratio and proportion and graph their answers on a coordinate plane. They solve word problems using geometry.
Curated OER
Contemporary Immigration
Eleventh graders analyze the patterns and waves of immigrants that have come to the United States from 1850 to 2000. They participate in a class discussion about immigration, and in small groups conduct research analyzing and evaluating...
Texas State University
Earth: Deposition and Lithification
Geology geniuses analyze sediment samples with a hand lens and sort according to physical characteristics. They also learn about the processes of cementation, compaction, and lithification within the rock cycle. The lesson plan is...
Curated OER
Introduction to the National Debt
Students relate the national debt to the economy. In this algebra lesson, students discuss what the national debt is, create a national budget based on priority and what the government should spend money on. They analyze their findings...
Curated OER
Understanding "The Stans"
Students explore and locate "The Stans" in Central Asia to create, write and illustrate maps, graphs and charts to organize geographic information. They analyze the historical and physical characteristics of Central Asia via graphic...
Curated OER
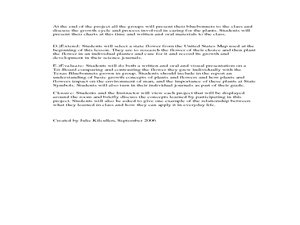
How Does Your Blue Bonnet Grow?
Young scholars explore the conditions needed to grow Texas Blue Bonnets. In this Blue Bonnet planting lesson, students recognize the differences in Texas Blue Bonnet. Young scholars record their findings in a graphs and analyze their...
Curated OER
Mathematics Module
Delve into graphing! The concepts covered begin with basic graphing basic coordinates and algebraic expressions on coordinate planes, and build up to graphing linear inequalities and equations. Learners solve and simplify various...
Curated OER
A Research Project and Article For the Natural Inquirer
Get your class to use the scientific process to solve a scientific problem. They utilize the Natural Inquirer magazine to identify a research question which they write an introduction to and collect data to answer. They use graphs,...
Maryland Department of Education
Our Children Can Soar
Amazing efforts of African American leaders are celebrated in a lesson plan on civil participation. The engaging resource focuses on primary and secondary sources to analyze the impact of African American leaders such as Ella Fitzgerald....
Curated OER
Visual Literacy: Using Images to Increase Comprehension
A colorful PowerPoint is a great way to introduce the topic of visual literacy. The eye-catching presentation begins with an overview of visual literacy and then provides some specific strategies to help enhance reading comprehension. As...
Federal Reserve Bank
The Output Gap: A‘Potentially’ Unreliable Measure of Economic Health?
How can we accurately estimate what the economy should produce now and in the future? Have your pupils tackle this question as they learn about real versus potential GDP and as they review data regarding the output gap in the United States.
Curated OER
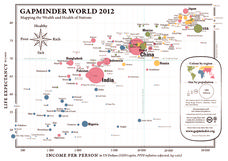
Gapminder World 2012
Here is a very interesting infographic that compares the average life expectancies, per capita incomes, and population sizes of every country in the world in 2012.
Curated OER
Perceived Risks
Learners rank a list of everyday risks to compare with classmates. They rate each risk on both its ability to be controlled and its observability in the environment. Results are graphed.
Curated OER
East Asia Country Project
Get your young historians thinking about East Asian culture and history during this partner research project, in which they analyze a variety of East Asian aspects to prepare for a presentation. After an initial "what do we already know"...
Curated OER
Cross Cultural Transportation and Resources Exchange
Students examine various modes of transportation. They explore regional transportation options and discover options available in their area. Students survey types of transportation people use in their area. Using spreadsheet data,...
Curated OER
Handling Data: Comparing Distributions
Young scholars gather information by analyzing graphs, diagrams and pie charts. In this graphs and diagrams lesson, students complete addition and subtraction problems. Young scholars discuss a pie chart. Students use information to...
Curated OER
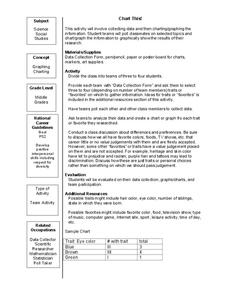
Chart This!
Students collect data and graph or chart the information. In this data organization lesson, students poll their classmates about certain topics and chart or graph the information to show the results of their research.
Curated OER
Math Made Easy
Students evaluate word problems. In this problem solving lesson, students are presented with word problems requiring graphing skills and students work independently to solve.


