Curated and Reviewed by
Lesson Planet
This Gapminder World 2012 printable also includes:
- Graphic & Image
- Informational Text
- Join to access all included materials
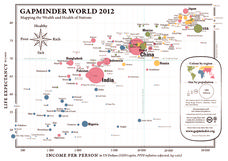
Here is a very interesting infographic that compares the average life expectancies, per capita incomes, and population sizes of every country in the world in 2012.
147 Views
131 Downloads
CCSS:
Adaptable
Concepts
Additional Tags
Instructional Ideas
- Approach document as a method of practicing analyzing graphs/charts, particularly highlighting how to read a legend/key
- Use as a supplemental resource when studying economic systems and/or forms of government
- Prompt class members to identify a country that interests them based on analysis of this resource, and then have them research more about the circumstances that contribution to its current standings
Pros
- Very modern and engaging design that offers a great alternative to a traditional graph or chart
Cons
- None


