Curated OER
Mean, Median, and Mode
Fourth graders compare two sets of data by using a double bar graph. For this data analysis lesson, 4th graders study a double bar graph and complete questions based upon the data. Students construct a table to show the data from the...
Curated OER
M & M Madness
Students work with the mathematics unit of collection, organization, and presentation of data. In this math and technology lesson plan, students use Valentine M & M’s and The Graph Club to sort and graph the various colored M & M’s.
Curated OER
Does Humidity Affect Cloud Formation?
Students use S'COOL data to identify factors that affect cloud formation. They find a data set using the S'COOL database , and use Excel to manipulate the data. Student isolate relevant data, create meaningful graphs from a spreadsheet,...
Curated OER
Parachute Drop
Learners will have fun creating a parachute to collect data with. They will construct the parachute in small groups, measure the materials, and create an observation sheet. Then they drop the parachute and make predictions about how long...
Curated OER
What is the Best Chip?
Scholars collect data about chips. They pick their favorite type of chip from a given variety such as potato chips, tortilla, or banana chips. Then they write on an index card their favorite chip and why it's their favorite. They also...
Virginia Department of Education
Growing Patterns and Sequences
Learners explore, discover, compare, and contrast arithmetic and geometric sequences in this collaborative, hands-on activity. They build and analyze growing patterns to distinguish which kind of sequence is represented by a set of data...
Chicago Botanic Garden
GEEBITT (Global Equilibrium Energy Balance Interactive TinkerToy)
Students use the GEEBITT excel model to explore how global average temperatures are affected by changes in our atmosphere in part two of this series of seven lessons. Working in groups, they discuss, analyze graphs, and enter data to...
Curated OER
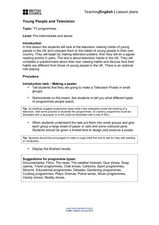
Young People and Television
Students explore communication by participating in a role playing lesson. In this media analysis lesson, students answer surveys about their own television watching habits and compare them to the rest of the class. Students complete...
Curated OER
The Guise of a Graph Gumshoe
Eighth graders practice constructing bar, circle, and box-and-whisker graphs. They practice reading and interpreting data displays and explore how different displays of data can lead to different interpretations.
Curated OER
Eat Your Veggies
Students investigate displaying data. In this displaying data lesson, students use tallies to count data about food preferences. Students use various types of graphs such as bar graphs, picture graphs, box-and-whisker plots, etc to...
Curated OER
Spaghetti Graphs
Learners work in pairs to test the strength of spaghetti strands. They collect and graph data to determine a line of best fit. Students create a linear equation to interpret their data. Based on the data collected, learners predict...
Curated OER
When the Snow is as High as an Elephant
High schoolers study the concept of mean values using a data plot. Learners enter the given data in the activity to create their data table. They use the data table to calculate the mean of the snowfall percentage provided in the...
Curated OER
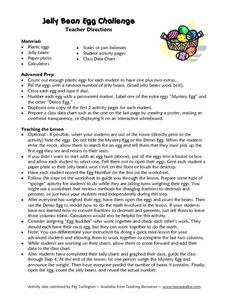
Jelly Bean Egg Challenge
Young scholars each receive a plastic egg filled with jelly beans. In this Jelly Bean Egg Challenge, students estimate and weight their eggs, they count the number of jelly beans inside their egg, they chart their data and compare their...
Curated OER
Weather instruments
Students explore weather instruments. In this weather lesson, students make rain gauges, anemometers, and barometers following the instructions given in the lesson. Students set up a weather station using their instruments and record and...
EngageNY
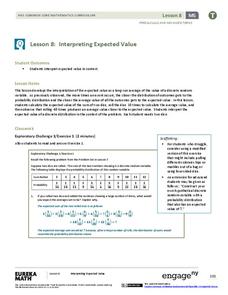
Interpreting Expected Value
Investigate expected value as a long-run average. The eighth installment of a 21-part module has scholars rolling pairs of dice to determine the average sum. They find aggregate data by working in groups and interpret expected value as...
Curated OER
Walking on Air
Pupils collect and analyze data with a graph. In this statistics instructional activity, students use central tendencies to find the meaning of their data. They display the data on a Ti calculator.
Curated OER
How High Are the Clouds?
Learners analyze height and collect data to create a graph. In this statistics lesson, students use central tendencies to analyze their data and make predictions. They apply concept of statistics to other areas of academics to make a...
Curated OER
Charting and Graphing Sales
Students analyze graphs, charts and tables. In this data analysis lesson plan, students practice creating and analyzing charts, graphs and tables corresponding to sales and surveys. This lesson plan uses data relevant to students and...
Curated OER
Get the Picture with Graphs
Fifth graders examine line, bar and circle graphs in the newspaper and on the Internet. They complete sketches of graphs with an emphasis on selecting the best model to depict the data collected.
Curated OER
What's The Teacher's Choice?
Fifth graders explore how to use data and display it using a chart or graph. They use food choices for categories and then gather the data and use the provided chart for display. In small groups students discuss the data and the results.
Curated OER
Data Shuffle
Middle schoolers find an advertisement or newspaper using charts or graphs. They create another graph using the same information in a different format. They write a comparison of the two graphs.
Texas Instruments
Light and Day
Pupils explore the concept of collecting data as they collect data on their graphing calculator about time, temperature, and light. Learners plot the data and create histograms and box and whisker plots to analyze the data.
Discovery Education
Sonar & Echolocation
A well-designed, comprehensive, and attractive slide show supports direct instruction on how sonar and echolocation work. Contained within the slides are links to interactive websites and instructions for using apps on a mobile device to...
University of Georgia
Endothermic and Exothermic Reactions
Equip your chemistry class with the tools to properly understand endothermic and exothermic reactions. Young chemists collect, analyze, and graph data to determine how the Law of Conservation of Matter is applied to chemical composition...


