Willow Tree
Box-and-Whisker Plots
Whiskers are not just for cats! Pupils create box-and-whisker plots from given data sets. They analyze the data using the graphs as their guide.
CK-12 Foundation
Bar Graphs, Frequency Tables, and Histograms: Comparing Heights
Become a master at creating visual displays. Using a provided list of heights, users of the interactive create a bar graph and a histogram. They answer a set of challenge questions based on these data representations.
Curated OER
Holiday Tally
For this tally chart worksheet, students ask ten friends which of 3 holidays they like best. Students create a tally chart with their results and answer 6 questions.
Curated OER
Freshman Project-Part 5
In this project instructional activity, 9th graders display their data, the make a graph and they answer analysis and conclusion questions on their experimental design project. They discuss the variables of their experiment, their major...
Curated OER
Statistics of Mars
Students explore the concept of central tendencies. In this central tendencies lesson, students sort M&M's or Skittles based on color. Students graph their results. Students find the mean, median, and mode of their data.
CK-12 Foundation
Mode: Kittens
It is not as difficult as herding cats. The short interactive provides a group of kittens to sort according to their colors. Pupils determine the mode of the number of kittens by color. The questions continue with other numbers of...
CK-12 Foundation
Multiple Bar Graphs
I scream, you scream, we all scream for ice cream bar graphs. Pupils create a multiple bar chart to represent the sales of ice cream products during the first week of summer. Using the chart, learners find the day that each of the...
EngageNY
Determining the Equation of a Line Fit to Data
What makes a good best-fit line? In the 10th part of a 16-part module, scholars learn how to analyze trend lines to choose the best fit, and to write equations for best-fit lines to make predictions.
PBL Pathways
Students and Teachers 2
Examine trends in student-to-teacher ratios over time. Building from the first task in the two-part series, classes now explore the pattern of student-to-teacher ratios using a non-linear function. After trying to connect the pattern to...
Shodor Education Foundation
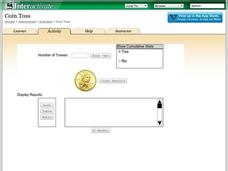
Coin Toss
Are your young mathematicians having a hard time making heads or tails of probabilities? It's no toss up—here is a resource that's sure to straighten them out! Learners run the interactive to toss a coin a different number of times....
Shodor Education Foundation
Sequencer
Take the first step into graphing sequences. Learners set the starting number, multiplier, add-on, and the number of steps for a sequence. Using the inputs, the interactive calculates and plots the sequence on the coordinate plane. Users...
CK-12 Foundation
Pie Charts: Soda Party
Using the interactive, pupils create a pie chart that represents the percentage of sodas bought for a party. Individuals need to determine the percentage and number for the final variety of drinks. The learners determine how the...
Curated OER
Mystery Jars
This is a twist on the old "guess how many jellybeans" game. Using estimation and math skills, learners participate in a fun "mystery jars" activity, trying to make educated guesses at how many objects are in two jars. The basic activity...
Curriculum Corner
Our Classroom Birthdays
Combine getting to know one another and math with a worksheet that focuses on graphing birthdays. Scholars collect data to discover how many peers share birthday months and fill in a bar graph for visual representation.
Teach Engineering
Density Column Lab - Part 1
Mass and density — aren't they the same thing? This activity has groups use balance beams and water displacement to measure several objects. The pupils use the measurements to calculate the density of the objects.
Biology in Motion
Evolution Lab
Evolution occurs though change over time, but can it go any faster? Scholars speed up the process of evolution and observe a simulation of 20 blue organisms fighting for survival. A graph displays the changes in phenotype over time. By...
Curated OER
Position vs. Time Graphs of an Object at Rest
The presentation includes nine time vs. position graphs. The first three are meant to be used for teaching how to read them. The next three provide an opportunity for students to practice reading them, while the last three display the...
Curated OER
Looking for More Clues
Fifth graders explore how to collect data and display it on a bar and circle graph.
Curated OER
Beverage Tests
Learners investigate the pH of a liquid. In this middle school mathematics/science lesson, students collect and analyze data regarding the pH of various liquids. Learners display their data in various types of graphs as they consider...
Curated OER
Lessons for Atlatl Users with Some Experience-Grade 6
Sixth graders experiment with an atlatl and dart. In this sixth grade data management mathematics instructional activity, 6th graders explore and determine the most suitable methods of displaying data collected from their...
Curated OER
Weather
Students create a spreadsheet and chart using data collected. In this weather lesson, students select five cities from their state, including the city they live in. Students take daily temperature readings from all five cities. ...
Curated OER
Mathematics and Environmental Concerns
Students gather data and analyze behaviors regarding recycling. In this environmental concerns unit, students discus and examine reuse, recycle, and reduce. Students collect, graph, and display data associated with four lessons in the...
Alabama Learning Exchange
Keep It Movin'!
Learners conduct an experiment to study friction. They complete a KWL chart on friction and conduct an activity about the amount of friction on a moving object. To conclude, pupils create a table or graph of the data collected and they...
Curated OER
Pizza, Pizza
Learners survey community members to determine their favorite pizza toppings and create a bar graph to show their findings. In this probability and statistics lesson, students collect data by conducting a survey. They analyze the data,...


