Curated OER
Graphs and Data
Students investigate poverty using graphs. In this algebra activity, students collect data on the effects of poverty and use different rules to analyze the data. They graph and use the trapezoid rule to interpret the data.
Statistics Education Web
Saga of Survival (Using Data about Donner Party to Illustrate Descriptive Statistics)
What did gender have to do with the survival rates of the Donner Party? Using comparative box plots, classes compare the ages of the survivors and nonsurvivors. Using the same method, individuals make conclusions about the gender and...
Population Connection
Where Do We Grow from Here?
Did you know that the population is expected to grow to 11 billion by 2100? The resource serves final installment in a six-part series on the global population and its effects. Scholars interpret data from the United Nations about the...
Center for History Education
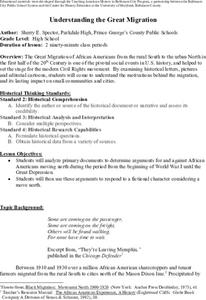
Understanding the Great Migration
What would make someone leave home and travel thousands of miles to find another one? Young historians look at letters, demographic data, and artwork to answer the question for the Great Migration, or the movement of thousands of African...
Population Connection
A Demographically Divided World
Did you know that birth and life rates vary across the world? The resource, the second in a six-part series, discusses just how demographics differ across countries and why it might be the case. Scholars complete worksheets, watch...
Curated OER
Beyond Demographics
Students study the Dominican Republic through watching and discussing a video about the country and its people. They explain life in the Dominican Republic and describe the emerging picture of the Dominican Republic as viewed through...
School Improvement in Maryland
Demographic Investigation
What are the factors that influence voting patterns? How do these factors influence government funding? Is participation the squeaky wheel gets the grease? Class members interpret graphs and analyze trends to determine what demographic...
Curated OER
Whoa! Slow Down-Some of You!
Students analyze demographic data (growth rate, natural increase, fertility rate, crude birth rates, and crude death rates) and determine which areas of the world contain the fastest and slowest growth rates. They construct population...
Curated OER
The Demographics of Immigration: Using United States Census Data
Students work together to analyze United States Census data on immigration. They compare and contrast the data and determine how immigration numbers have changed over time. They calculate percentages and make their own conclusions...
Carolina K-12
Who the People? Representative Democracy in North Carolina and Congress
Our elected officials are supposed to represent us, but what does it mean when they aren't like us? Budding citizens explore the demographic makeup of the US Congress, the role of money in political elections, and the Citizens United...
Curated OER
Discovering Demographics
High schoolers analyze demographic data including a statistical overview of India. Students synthesize their findings and create an informational poster about India.
Curated OER
Handling Data- Health Statistics
In this social studies worksheet, students organize 50 country cards into groups. Students analyze a chart and group countries according to lowest, middle, and highest Infant Mortality Rate.
Curated OER
Population Fundamentals-Building a Foundation
Students present demographic data in a graphic format that supports analysis and interpretation.
Curated OER
Teenage pregnancy trends in Canada
Students analyze demographic data relating to teen pregnancy trends. They develop skills to locate and interpret data. They discuss the factors that influence teenage pregancy such as social, economic, and educational issues.
US Department of Commerce
Diversity: Census Questions Over Time
The story of race in the United States continues to evolve, and the numbers show it. Using data from the last two census counts, learners consider recent demographic shifts. They then analyze the information to hypothesize: What could...
Curated OER
World Cities of 5 Million or More
Students consult online resources to identify and map the world's largest cities and metropolitan areas. They analyze birth rates, settlement patterns and other demographic data and make predictions for the future. They write essays...
Curated OER
Analyzing the Job Market for Babysitting in Your Neighborhood
Students conduct research on a neighborhood in Canada. In this data analysis lesson, students use data from the 2006 Canadian census to draw conclusions about a population group.
Teaching Tolerance
Changing Demographics: What Can We Do to Promote Respect?
America has always been seen as a melting pot to the world. Scholars research the concept of blending cultures in the United States and how it is changing over time. The final lesson of a four-part series analyzes the changing...
Curated OER
World Statistic Day
Eleventh graders collect data about the state they live in. In this statistics lesson, 11th graders collect and analyze data as they compare themselves to students in other states. They analyze data about a person's education level, and...
Curated OER
Population-Building a Foundation
Students research to find information about populations and complete world maps by labeling the current population, and determining the 10 countries with the largest population. They search the "World Population Data Sheet." On the third...
Curated OER
How Many Is Too Many?
Students explore the population explosion. They view a video depicting the exponential growth of human population. Students research the internet to project future population data. They perform hands-on, multimedia activities to study...
Population Connection
The Peopling of Our Planet
How many people live on the planet, anyway? The first resource in a six-part series covers the topic of the world population. Scholars work in groups to conduct research and make population posters after learning about the global...
Curated OER
Canada 2050: Future Population Trends
Students analyze population data and a population pyramid projection for Canada. They make predictions of future society and economic trends.
Curated OER
Canada 2050: Future Population Trends
Students analyze population data and a population pyramid projection for Canada. Using this information, they predict what the future trends in the population might be and its effect on Canadian society as a whole. They compare and...


