Curated OER
No Title
Sixth graders, after reviewing and studying the basics of recording, analyzing and presenting data, create on graph paper a bar or line graph to represent given data and then interpret the data. They answer questions about the given data...
National Council of Teachers of Mathematics
Geogebra: Residuals and Linear Regression
If the line fits, use it. Using a Geogebra interactive, pupils plot points and try to find the best fit line. They assess the linear fit by analyzing residuals. A radio button allows participants to show the regression line and the...
K20 LEARN
You’re The Network: Data Analysis
How do you rate? Young scholars use graphical data to analyze ratings of different television episodes. Their analyses include best-fit lines, mean, median, mode, and range.
Curated OER
Timed Multiplication Test Graphs
Students use the tools of data analysis for managing information. They solve problems by generating, collecting, organizing, displaying histograms on bar graphs, circle graphs, line graphs, pictographs and charts. Students determine...
Curated OER
Data Collection - Primary Poster
Students explore the concept of collecting, analyzing, and graphing data. In this collecting, analyzing, and graphing data lesson, students create a survey about a topic of interest. Students poll their classmates, analyze, and graph...
Curated OER
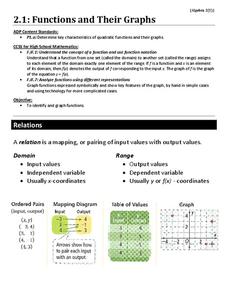
Functions and Their Graphs
Use a instructional activity to go over the basic concepts of relations and functions. Included are clear definitions and examples of relations, domain and range, and functions and the vertical line test. However, the problems are...
Curated OER
Geometry: Parallel and Perpendicular Lines
This basic handout would be good for skills practice or a review of parallel and perpendicular lines. Review the definitions, then practice writing equations of lines that pass through a specific point and are either parallel or...
Curated OER
Challenge: Graphing Functions
Here is a functions worksheet in which learners solve functions containing variables, graph the coordinates, and answer two questions about it. They complete 14 functions.
Curated OER
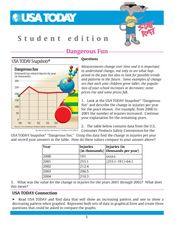
Dangerous Fun
In this line graph worksheet, students analyze the data on a graph about toy-related injuries by year. Students solve 5 problems in which the change in injuries per year is calculated and recorded on a table.
Curated OER
Graphing Quadratic Equations
Review the form of a quadratic function, and the parabola it creates. Continue on with the whole group to work through a mini-lab, practicing how to graph quadratic equations with one variable. The goal of this lesson is for the group...
Curated OER
Linear Functions
Your learners will explore linear functions by analyzing a graph of the linear equations.Then learners analyze through calculating f(x+P) and g(x+p)
Curated OER
Data Analysis Challenge
In this data analysis worksheet, young scholars work with a partner to collect information for a survey. The information is then compiled into a graph. Students must indicate their survey question, the target audience, predict the...
Curated OER
Data Display
Students explore different ways to display data. In this statistics lesson plan, students create pie charts, bar graphs and line graphs to show data. Students then write a paragraph discussing which types of graphs are helpful for...
Curated OER
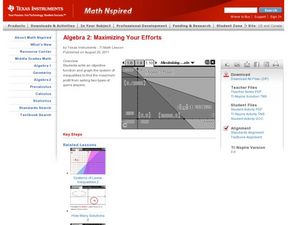
Maximizing Your Efforts
Students graph systems of equation. In this algebra instructional activity, students find where the lines cross and identify the type of solution. They analyze a graph and write the equation of the line.
Curated OER
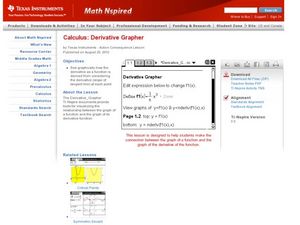
Derivative Grapher
Learners graph the derivative of functions in this calculus lesson. They use the TI to graph their functions and algebraically take the derivative of each function. They then create a visual and analyze the graph.
Curated OER
Statistics
In this statistics worksheet, learners solve 2 problems that involving plotting data, recognizing ordered pairs, and analyzing the graphed relationship.
Curated OER
Decisions, Decisions, Decisions
Students examine graphs to find the most appropriate for various kinds of data. In this graphing instructional activity, student create bar, line and circle graphs. Students create graphs electronically and manually interpreting the data.
Curated OER
Lines of Fit
Students graph an equation and analyze the data. In this algebra lesson, students graph scatter plots and identify the line of best fit using positive correlation, negative correlation an d no correlation. They apply their data analysis...
Curated OER
Lines of Fit
Students graph an equation and analyze the data. In this algebra lesson plan, students graph scatter plots and identify the line of best fit using positive correlation, negative correlation an d no correlation. They apply their data...
Curated OER
Graphs and Direct Variation
Students solve problems with direct variation. In this algebra lesson, students analyze graphs to figure out the direct variation of a line. They observe the slopes based the steepness of the lines.
Curated OER
Which Amusement Park Would You Choose?
Students analyze data related to amusement parks and create a spreadsheet to display the data. They read the data and predict which amusement park they think is safer, create a spreadsheet and graph, and write a proposal based on their...
Curated OER
Graphs of Direct Variation
Young scholars identify graphs for direct variation. In this algebra worksheet, students analyze graphs to determine their direct variation. They also determine whether the graphs are functions or not.
Curated OER
Analyzing Graphs and Data
Students collect and analyze data. In this statistics instructional activity, students graph their data and make inferences from the collected data. They display their data using graphs, bar graphs, circles graphs and Venn diagrams.
Curated OER
Graphing Linear Equations
Students graph linear equations. In this algebra lesson, students investigate the price of tolls in different states and create a graph. They analyze their graph and draw conclusions.


