Willow Tree
Line Plots
You can't see patterns in a jumble of numbers ... so organize them! Learners take a set of data and use a line plot to organize the numbers. From the line plot, they find minimum, maximum, mean, and make other conclusions about the data.
EngageNY
Mid-Module Assessment Task - Algebra 2 (Module 1)
Challenge classes to think deeply and apply their understanding of polynomials. The assessment prompts learners to use polynomial functions to model different situations and use them to make predictions and conclusions.
EngageNY
Calculating Conditional Probabilities and Evaluating Independence Using Two-Way Tables (part 2)
Without data, all you are is another person with an opinion. Show learners the power of statistics and probability in making conclusions and predictions. Using two-way frequency tables, learners determine independence by analyzing...
Peace Corps
Introducing Culture
Growing up within a culture leaves a lot of ideas and values unspoken. Take a closer look at the cultures in which your learners live with a discussion activity that addresses cultural identity and traits of those living within the...
Statistics Education Web
Now You SeeIt, Now You Don't: Using SeeIt to Compare Stacked Dotplots to Boxplots
How does your data stack up? A hands-on activity asks pupils to collect a set of data by measuring their right-hand reach. Your classes then analyze their data using a free online software program and make conclusions as to the...
Teach Engineering
Understanding the Air through Data Analysis
Is there a correlation or causation relationship between air pollutants? Groups develop a hypothesis about the daily variation of air pollutants, specifically ozone and CO2. Using Excel to analyze the data, the groups evaluate their...
EngageNY
Four Interesting Transformations of Functions (Part 4)
What do you get when you cross piecewise functions with transformations? An engaging lesson! The conclusion of a four-part series on the transformations of functions asks class members to apply transformations to piecewise functions...
Western Kentucky University
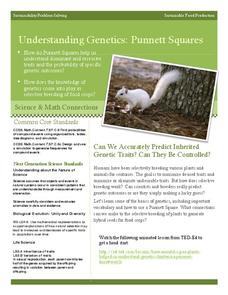
Understanding Genetics: Punnett Squares
Can scientists really predict genetic outcomes or are they simply making a lucky guess? Scholars first learn about Gregor Mendel and how to make Punnett squares. Then they extract DNA from a strawberry in a lab with included conclusion...
EngageNY
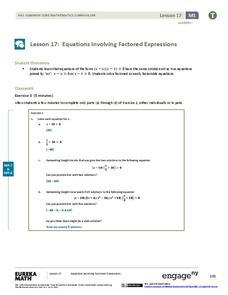
Equations Involving Factored Expressions
Be ready mathematicians of every level. This instructional activity leads to the discovery of the zero product property and provides challenges for early finishers along the way. At conclusion, pupils understand the process of using the...
EduGAINs
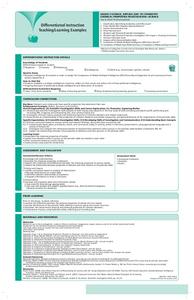
Chemical Properties Investigation
This lesson demonstrates differentiated instruction at its best. Over the course of 2-3 class periods, young chemists have the opportunity to gain a thorough understanding of metals and their chemical properties from a variety of...
Balanced Assessment
Solar Elements
Let your brilliance shine like the sun. Future mathematicians and scientists consider given data on the abundance of different elements in the sun. The assessment task requires consideration of how these different abundances relate to...
Statistics Education Web
Consuming Cola
Caffeine affects your heart rate — or does it? Learners study experimental design while conducting their own experiment. They collect heart rate data after drinking a caffeinated beverage, create a box plot, and draw conclusions. They...
Statistics Education Web
Saga of Survival (Using Data about Donner Party to Illustrate Descriptive Statistics)
What did gender have to do with the survival rates of the Donner Party? Using comparative box plots, classes compare the ages of the survivors and nonsurvivors. Using the same method, individuals make conclusions about the gender and...
Balanced Assessment
Frosting on the Cake
Party planners need algebra too! Here, pupils decide the perfect size of a cake based on available ingredients. They use the concepts of area and perimeter to make their conclusions.
Bowland
Public Transport
"Statistics is the grammar of science" -Karl Pearson. In the assessment task, learners read a claim made by a newspaper and analyze its conclusions. They need to think about the sample and the wording of the given statistics.
Kenan Fellows
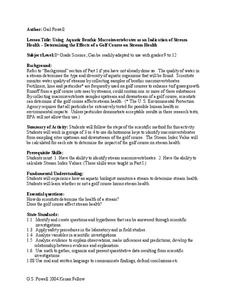
Effects of a Golf Course on Stream Health
Is the golf course causing issues in the stream? Find out with a resource that has groups perform chemical water tests to analyze the effects of a golf course on a stream. Pupils collect water above and below the course and analyze the...
EngageNY
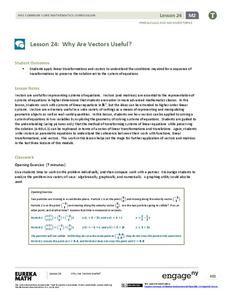
Why Are Vectors Useful? 2
Investigate the application of vector transformations applied to linear systems. Individuals use vectors to transform a linear system translating the solution to the origin. They apply their understanding of vectors, matrices,...
EngageNY
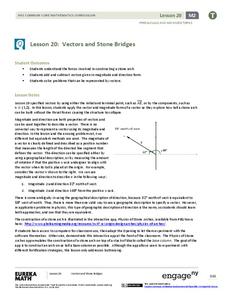
Vectors and Stone Bridges
What does it take to build a stable arch? Pupils apply vectors and physics as they examine arched bridges and their structural integrity. They use vectors to represent the forces acting on the stone sections and make conclusions based on...
US Department of Agriculture
Sink or Float?
Will it sink or will it float? Learners predict the outcome as they drop random objects into a container of water. Then, they keep track of the results and record the data in a t-chart to draw a final conclusion.
Kenan Fellows
Determining the Effects of a Golf Course on Stream Health
Do golf courses affect the water organisms in nearby streams and ponds? Small groups collect samples of water upstream and downstream from a golf course and analyze the macroinvertebrates found and the stream index values of the two...
EngageNY
Special Lines in Triangles (part 1)
Allow your pupils to become the mathematicians! Individuals explore the properties of a midsegment of a triangle through construction and measurement. Once they figure out the properties, learners use them to draw conclusions.
PHET
Mapping the Field of Multiple Dipole Magnets
So you built a magnetometer, now what? High school scientists use their magnetometer made in a previous lesson to map the union of magnetic fields of dipole magnets. They experiment with different alignments and draw conclusions about...
NOAA
Deep-Sea Ecosystems – A Tale of Deep Corals
Many have debated which came first, the chicken or the egg, but this lesson debates which came first, the hydrocarbons or the carbonate reef. After a discussion on deep-sea corals, scholars receive a set of questions to research and...
Polar Trec
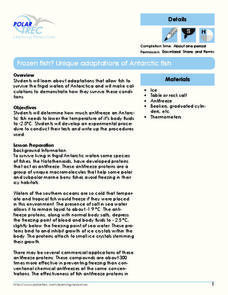
Frozen Fish? Unique Adaptations of Antarctic Fish
Some fish contain proteins that act like antifreeze in order for them to live in the frigid waters of Antarctica! High schoolers determine how much antifreeze a fish needs to lower its body temp to -2.5 degrees. Teachers act as a...


