Illustrative Mathematics
Illustrative Mathematics: 3.oa, Md, Nbt Classroom Supplies
The purpose of this task is for students to solve problems involving the four operations and draw a scaled picture graph and a scaled bar graph to represent a data set with several categories. Aligns with 3.NBT.A.2;...
Beacon Learning Center
Beacon Learning Center: Play Ball
An interactive web lesson shows examples of pictographs and challenges students to answer questions about the graphs.
ClassFlow
Class Flow: Pictograph With Key Greater Than 1
[Free Registration/Login Required] This flipchart introduces reading a pictograph with a key greater than one, answering questions from data represented, find number of symbols to represent data by using a key, construct pictograph, and...
ClassFlow
Class Flow: Explore a Pictograph
[Free Registration/Login Required] Use this flipchart to explore a pictograph. Create a pictograph and use the key of the graph to answer questions.
ClassFlow
Class Flow: Pictograph Intro
[Free Registration/Login Required] The teacher will use this lesson plan to introduce pictographs.
ClassFlow
Class Flow: Explore a Pictograph
[Free Registration/Login Required] This is a 2nd grade lesson on how to interpret information on a pictograph when each picture stands for more than one unit.
University of Saskatchewan (Canada)
Northern Research Portal: "Art and Artists" Exhibit
The Inuit and First Nations people tended to express their culture and history through artistic expression. Highlighted is the various art forms and artists of these people and especially the Northern region of Canada. Included are...
Government of Alberta
Learn Alberta: Math Interactives: Exploring Election Data
Using actual Alberta provincial election results, students have the opportunity to interpret election data using a variety of graph types. Pictographs, line graphs, bar graphs, circle graphs, and data tables are covered in this...
Toy Theater
Toy Theater: Fruit Fall
Students use their mouse to collect fruit and create a picture graph.
Khan Academy
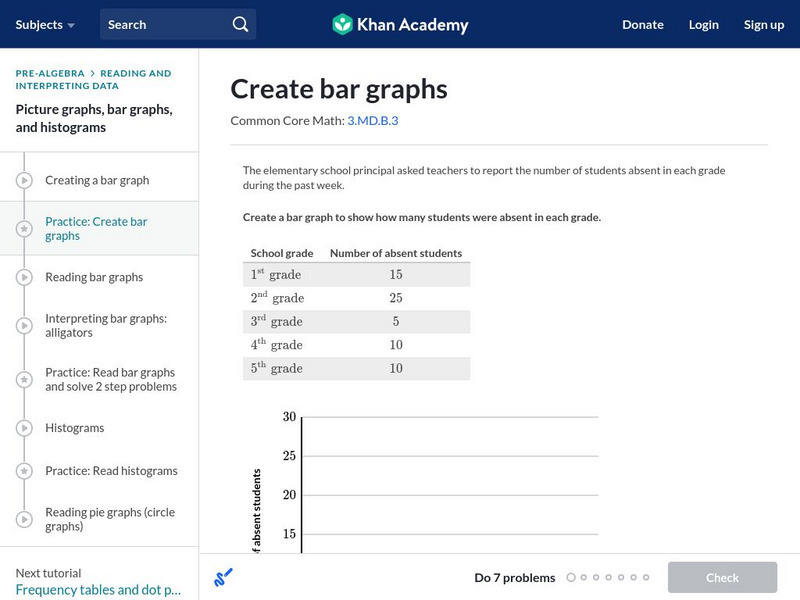
Khan Academy: Create Bar Graphs
Create a bar graph with the data given. Students receive immediate feedback and have the opportunity to try questions repeatedly, watch a video tutorial, or receive hints about creating bar graphs. CCSS.Math.Content.3.MD.B.3 Draw a...
Khan Academy
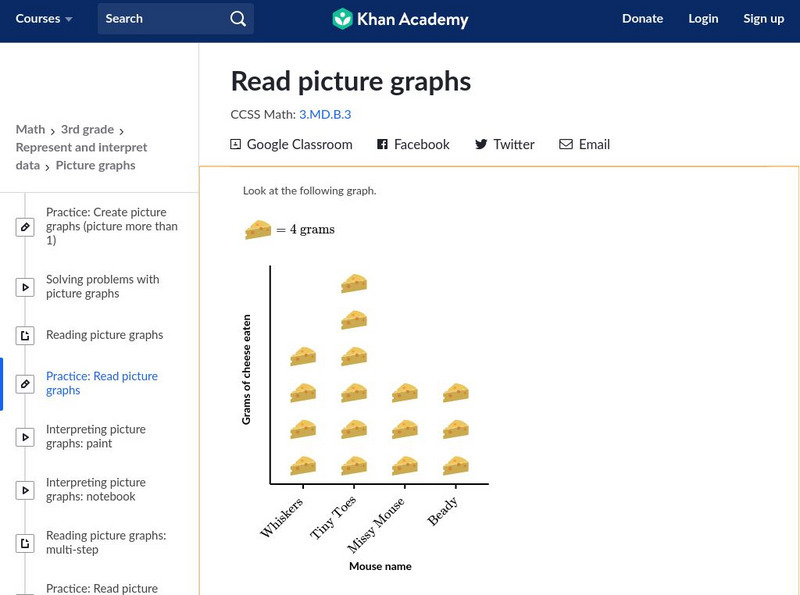
Khan Academy: Read Picture Graphs
Use picture graphs to solve word problems. Students receive immediate feedback and have the opportunity to try questions repeatedly, watch a video or receive hints. CCSS.Math.Content.3.MD.B.3 Draw a scaled picture graph and a scaled bar...
Khan Academy
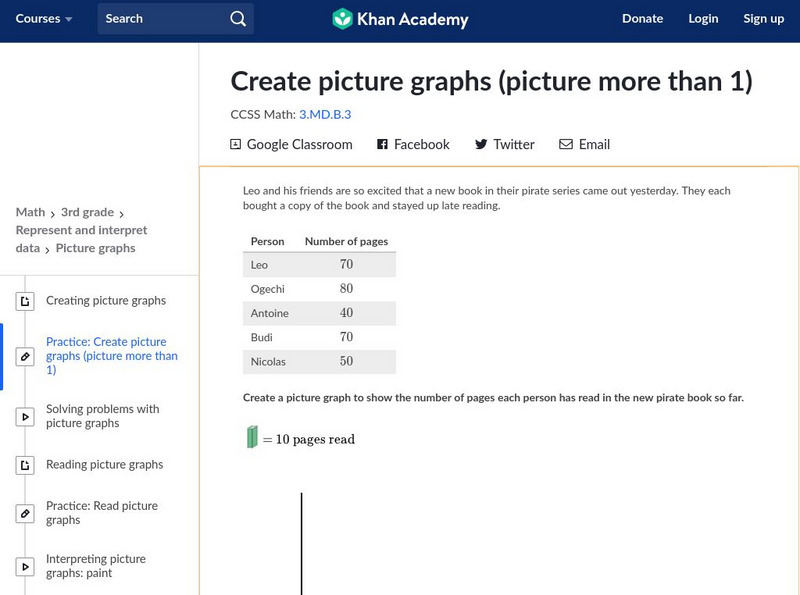
Khan Academy: Create Picture Graphs (Picture More Than 1)
Create and interpret picture graphs. Students receive immediate feedback and have the opportunity to try questions repeatedly, watch a video tutorial, or receive hints about how to create picture graphs. CCSS.Math.Content.3.MD.B.3 Draw a...
Library of Congress
Loc: Naxi Manuscript Collection
Naxi Kingdom flourished from the eighth century until 1724 when it came under direct Chinese rule. Naxi is the only living pictographic language.
Khan Academy
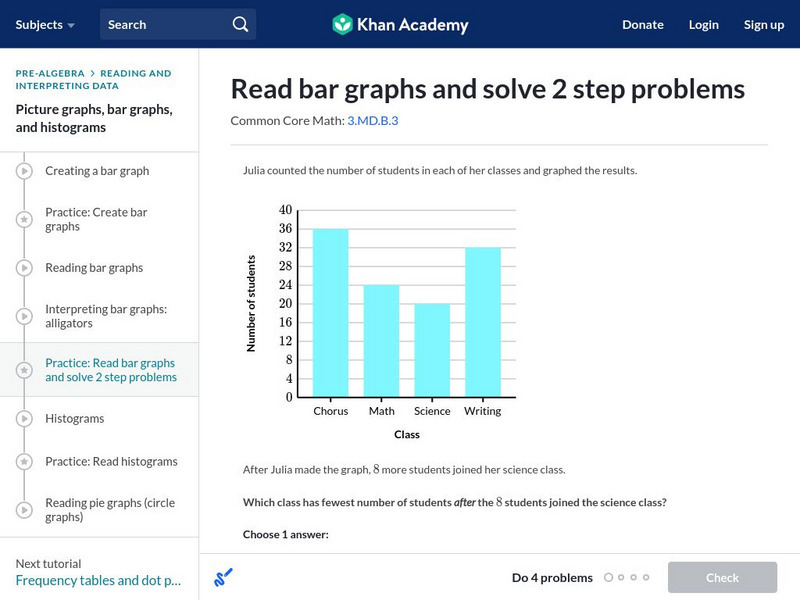
Khan Academy: Read Bar Graphs and Solve 2 Step Problems
Read and interpret a double bar graphs. Students receive immediate feedback and have the opportunity to try questions repeatedly, watch a video or receive hints. CCSS.Math.Content.3.MD.B.3 Draw a scaled picture graph and a scaled bar...
Library of Congress
Loc: The Huexotzinco Codex
Students will analyze a set of pictograph documents created by native peoples of Puebla, Mexico in 1531. Students will take on the role of historians, study the documents, and create a scenario to explain what these documents were for,...
American Geosciences Institute
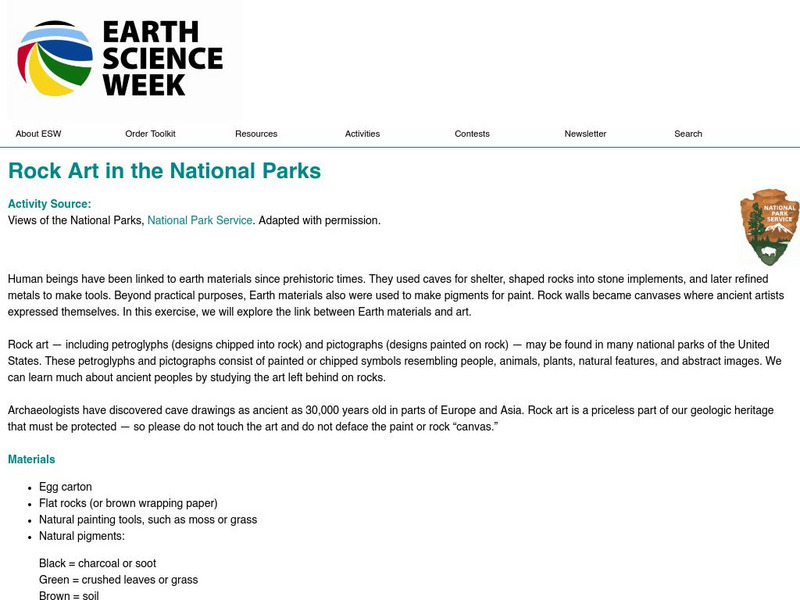
American Geosciences Institute: Earth Science Week: Rock Art in the National Parks
Students learn the importance of protecting pictographs as part of their geologic heritage by making their own paint using natural ingredients to create art.
Khan Academy
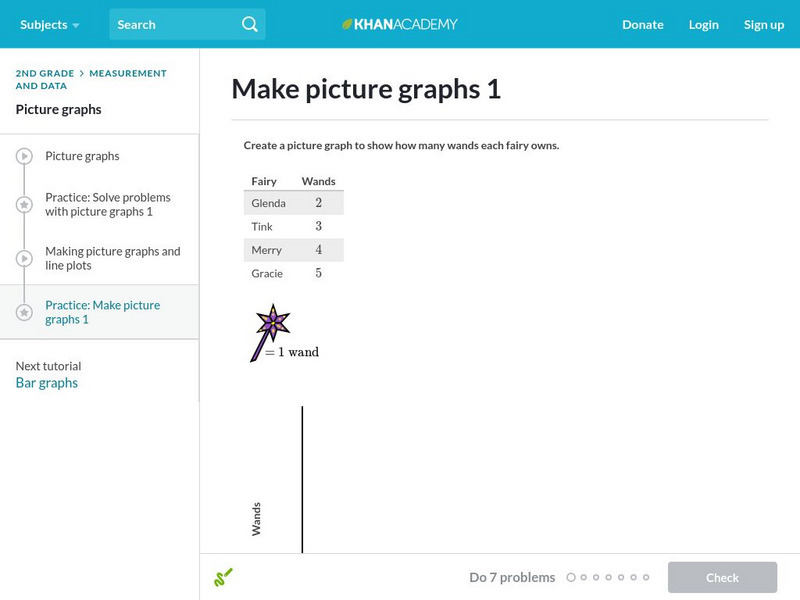
Khan Academy: Make Picture Graphs 1
Practice creating picture graphs (pictographs) from data sets. Students receive immediate feedback and have the opportunity to try questions repeatedly, watch a video or receive hints.
Khan Academy
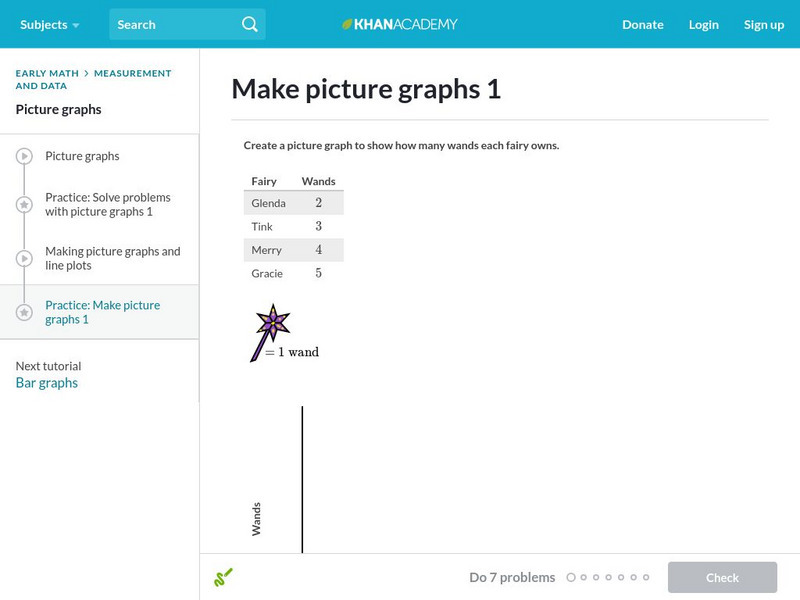
Khan Academy: Make Picture Graphs 1
A practice quiz where students construct the pictographs described in the problems. Includes hints.
Khan Academy
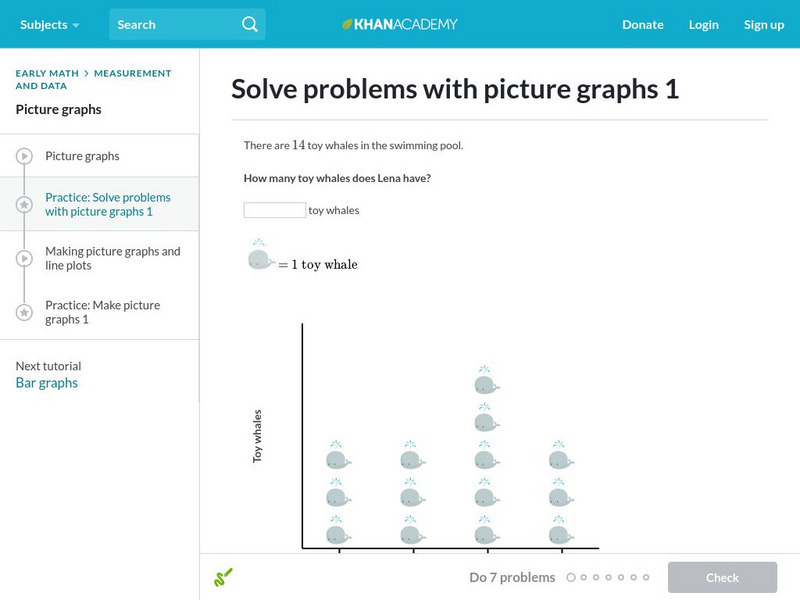
Khan Academy: Practice: Solve Problems With Picture Graphs
A practice quiz where students solve the problems by studying the pictographs. Includes hints.
Alabama Learning Exchange
Alex: Writing Native American Style
In this lesson plan students will reinforce their knowledge about Native Americans and their culture. They will also be introduced to Native American writing. The students will read The Legend of The Indian Paintbrush by Tomie de Paolo...
Better Lesson
Better Lesson: Graphing Our Snack Mix: Review of Graphing
Second graders review how to make bar graphs, line plots, and pictographs by tallying the contents of snack mix and building graphs to show their data.
California State University
Lesson Plan: Pictograph Stone Carving
This lesson plan provides a fun art activity about stone carving.
BBC
Bbc: Representing Data
This BBC Math Bite tutorial for line graphs, pictograms, and frequency polygons features an exam in which students draw and interpret statistical diagrams.
Beacon Learning Center
Beacon Learning Center: I Am Special
An interactive web lesson introduces students to picture graphs. It also allows them to practice creating and interpreting the graphs.


