Curated OER
Buses
Busy buses bustling back and forth. For this middle school assessment task, learners use information given in a graph to answer questions about bus schedules. They then determine how many times a bus passes by other buses going in the...
Curated OER
Photosynthesis
We all know photosynthesis happens, but why should we care? Here is a unit that covers everything young scholars need to know about photosynthesis. Hands-on activities, assessments, and lectures guide pupils though the physiology of...
Curated OER
Create a Healthy Calendar
Health nuts create a month-long calendar presenting health-themed pictures, tips, or facts in each day's box. Rather than just a project, you could raise the required number of health facts and use this as a unique assessment of...
Curated OER
Interpreting Music Data Rubric
In this interpreting music data rubric worksheet, students use this rubric as an assessment tool. It is designed to evaluate the students' music presentation.
PBS
Inspector Detector
How do spacecraft detect magnetic fields? The fourth installment of a five-part unit has learners develop a device with magnets that allows for the detection of magnetic fields. They use a map of an imaginary planet to try out their...
Curated OER
Hot Under The Collar
Pupils try to get a collar on temperature with a short assessment item that asks them to compare two different methods in converting Celsius to Fahrenheit. Individuals try to find out when an estimation provides conversions that are...
Curated OER
Map It!
Fourth graders collect and explore different maps and their uses before using the program Pixie to create maps of geographic features, political features, and economic information for the state in which they live.
Curated OER
Mapping the Local Community
Young scholars review the symbols and legends of a map. In groups, they follow a set of directions to create a map showing the route to a specific place. They present their map to the class and review the basic components of a community.
Noyce Foundation
Photographs
Scaling needs to be picture perfect. Pupils use proportional reasoning to find the missing dimension of a photo. Class members determine the sizes of paper needed for two configurations of pictures in the short assessment task.
Inside Mathematics
Swimming Pool
Swimming is more fun with quantities. The short assessment task encompasses finding the volume of a trapezoidal prism using an understanding of quantities. Individuals make a connection to the rate of which the pool is filled with a...
Inside Mathematics
Scatter Diagram
It is positive that how one performs on the first test relates to their performance on the second test. The three-question assessment has class members read and analyze a scatter plot of test scores. They must determine whether...
Nebraska Department of Education
Curriculum For Careers
Learners explore potential learning, earning, and living goals that align with their personal goals and interests in a comprehensive unit that includes complete lesson plans, interactive notebooks, worksheets, overheads, rubrics,...
Noyce Foundation
Lawn Mowing
This is how long we mow the lawn together. The assessment requires the class to work with combining ratios and proportional reasoning. Pupils determine the unit rate of mowers and calculate the time required to mow a lawn if they work...
Alberta Learning
Great City-states of the Renaissance
Acting as journalists on a team to determine the most influential city-state of Renaissance Italy, your young historians will research, discuss, and compare the rise of Venice, Florence, and Genoa, and their influence in shaping a...
Inside Mathematics
Graphs (2004)
Show your pupils that perimeter is linear and area is quadratic in nature with a short assessment task that requests learners to connect the graph and equation to a description about perimeter or area. Scholars then provide a...
Concord Consortium
Sharp-Ness of Bends
Define the sharpest in the group. Given a section of a trail map, pupils determine a method to measure the sharpness of each turn in the path. Individuals then determine what modifications to their formulas to make to find the sharpness...
Edgate
Native Americans of the Lewis and Clark Trail
As part of a study of the Corps of Discovery expedition, class groups research the different Native American tribes Lewis and Clark encountered on their journey and share their findings with the class.
Thoughtful Education Press
Personal Narratives: Learning from Lessons Life Teaches Us
"First Appearance," Mark Twain's tale about overcoming stage fright, serves as a model of a personal narrative and gets young writers thinking about milestones in their own lives. After examining student models and considering the...
Mathematics Assessment Project
A Golden Crown?
In this assessment task, learners determine whether a crown with given information is composed of pure gold. The task expects algebraic and numerical solution methods, so unlike Archimedes, no bathtub is necessary.
Mathematics Assessment Project
Jane's TV
Jane wants a new television, but she's not sure what size to buy! Your middle schoolers can figure it out when they apply the Pythagorean theorem. Produced especially for meeting Common Core standards in geometry, this activity appeals...
Mathematics Assessment Project
Octagon Tile
A connecting-the-dots activity seems too easy for seventh grade but connecting vertices may prove a challenge. Class members first examine a figure created by drawing squares around the inside of an octagon and connecting the...
Mathematics Assessment Project
Sale!
Let's save some money! High schoolers investigate different options for price reductions. They then determine the best and worst sale from a list of options.
Curated OER
Candy Bars
There is often more to data than meets the eye. Scholars learn that they need to analyze data before making conclusions as they look at data that describes the number of candy bars boys and girls eat. They disprove a given conclusion and...
Mathematics Assessment Project
Journey
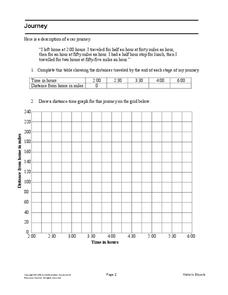
Drive home math concepts with an engaging task. Learners follow a verbal description to fill in a table and create a distance-time graph representing a car journey. They then answer questions by interpreting the graph.


