Shodor Education Foundation
Sequencer
Take the first step into graphing sequences. Learners set the starting number, multiplier, add-on, and the number of steps for a sequence. Using the inputs, the interactive calculates and plots the sequence on the coordinate plane. Users...
Shodor Education Foundation
Caesar Cipher
Caesar ciphers hide secret missives. A simple interactive lets users encode and decode hidden messages. The cipher method here is the Caesar shift.
Shodor Education Foundation
Box Plot
What information can come from a box? Learners choose a data set to display as a box plot and decide whether to include the median in the calculation of the quartiles, show the outliers, and change the scale. To finish the lesson,...
Shodor Education Foundation
Experimental Probability
Spin into a dicey experiment. Pupils use a spinner or a pair of dice to determine the experimental probabilities of each outcome. The interactive allows for either, one, five, or ten consecutive experiments. Using the applet, learners...
Shodor Education Foundation
Racing Game with One Die
Pupils roll a die to figure out which car advances on a race track. They determine the rules for each car moving forward and, given the statistics of the winner, compare if it matches their predictions.
Shodor Education Foundation
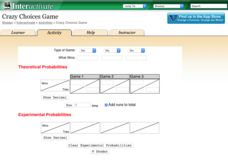
Crazy Choices Game
Wanna take a chance on which game is best? The resource provides three games of chance using multiple types of games. Games range from coin toss to cards. Choosing a type of game, pupils determine what wins and enter the theoretical...
Shodor Education Foundation
Spinner
Go round and round to compare theoretical and experimental probabilities. Learners set the number of sectors and the number of spins for a spinner. Then, a table displays the experimental and theoretical probabilities of the spinner for...
Shodor Education Foundation
Marbles
Grab some marbles from a bag. The applet simulates drawing marbles from a bag. Pupils determine the number of four colors of marbles in a bag and how many marbles to draw. Using information on whether order matters in the draw and if...
Shodor Education Foundation
Plop It!
Build upon and stack up data to get the complete picture. Using the applet, pupils build bar graphs. As the bar graph builds, the interactive graphically displays the mean, median, and mode. Learners finish by exploring the changes in...
Shodor Education Foundation
Measures
Take a look at data from a statistical lens. An interactive allows pupils to enter data set, labeling the data including the units used. Manipulating the applet, learners select the statistics to calculate that include total, mean,...
Shodor Education Foundation
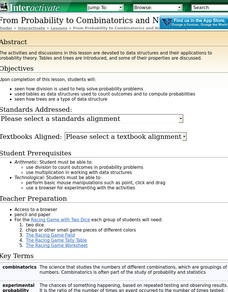
From Probability to Combinatorics and Number Theory
What middle schooler does not enjoy an occasional online game? In this instructional activity play, you will find embedded links to an online probability game, and informative pages about how division is used in probability, the concept...
Shodor Education Foundation
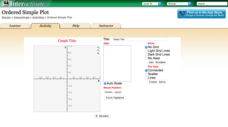
Ordered Simple Plot
Open your imagination to make algebra-inspired creations. An interactive lesson has scholars graph images from a set of parameters. Users can practice minimum values, maximum values, and scale as well as key features.
Curated OER
Winter Olympics History Year by Year
Investigate the history of the Winter Olympic Games. After researching this event and compiling necessary statistics, pupils use a graphic organizer to chart their findings. A template for a chart is included in this resource. Have your...
Shodor Education Foundation
Playing with Probability
Review basic probability concepts with your class using different-colored marbles in a bag. Then pair up learners and have them play a cool online interactive game in which they race miniature cars using the roll of a die or two. The...
Curated OER
Patterns in Pascal's Triangle
Young scholars examine the patterns in Pascal's Triangle. In this recognizing lesson, students view a model of Pascal's Triangle and describe the patterns of the multiples. Young scholars identify the shapes that are made within Pascal's...
Curated OER
Interactivate: Introduction to Functions
This interactive website provides a variety of lesson plans according to which standards you are applying and which textbook you use. Introduce functions to your class by having them construct single operation machines and create...
Curated OER
Reading Graphs
Working independently or in teams, your class practices connecting graphs, formulas and words. This lesson includes a guided discussion about distance vs. time graphs and looking at how velocity changes over time.
Curated OER
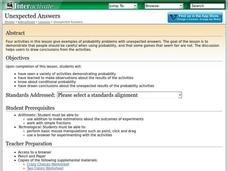
Unexpected Answers
Students explore the concept of fairness. In this fairness lesson plan, students play four probability games. Students determine who has the best chance of winning each of the four games. Students discuss which games gave an unfair...
Curated OER
Comparison of Univariate and Bivariate Data
Learners explore the concept of univariate and bivariate data. In this univaritate and bivariate data lesson, pupils discuss the differences between univariate and bivariate data. They work sample problems where they must construct box...
Shodor Education Foundation
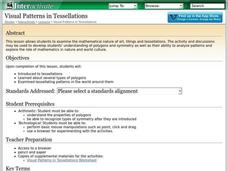
Visual Patterns in Tessellations
Geometers explore the concept of tessellations. They use a tessellation applet to manipulate shapes and design their own tessellation using the applet.
Curated OER
Linear Regression and Correlation
Learners explore scatter plots. In this linear regression lesson, groups of pupils graph scatter plots and then find the line of best fit. They identify outliers and explain the correlation. Each group summarizes and shares their...
Pennsylvania Department of Education
Build What I've Created
n this geometric lesson, students define and identify two dimensional shapes based on their attributes. They complete worksheets based on the geometric concepts.
Curated OER
Pedometer Activities to Enhance Cross-curricular Learning
Learners complete different activities involving pedometers such as writing a creative story, calculating step averages, researching pedometers, calculating calories, and much more.
American Statistical Association
Bear Hugs
Scholars research arm span to determine who gives the best bear hugs. They use data from a national study to find the standard statistics for arm span. It includes mean, median, quartiles, spread, standard deviation, and more.


