Curated OER
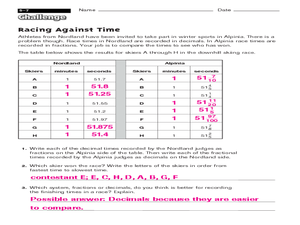
Racing Against Time
For this fractions worksheet, students complete a chart where they record fractions of minutes interpreted by seconds of how fast athletes were. Students complete 8 spots in the chart and 3 questions.
EngageNY
Displaying a Data Distribution
Pupils analyze a display of data and review dot plots to make general observations about the highest, lowest, common, and the center of the data. To finish, learners match dot plots to scenarios.
Curated OER
WNBA Supermom and Elapsed Time
Students watch a video of an WNBA athlete to learn about calendar scheduling and elapsed time. For this time management lesson, students watch the video for the WNBA athlete. Students record tips about time management and then complete...
Curated OER
Finding Averages as Means
Students calculate the mean. In this instructional activity on averages, students watch a video on athletes and averages and complete a worksheet. This instructional activity emphasizes mean as the "fair share measure of center".
Curated OER
LESSON 5: Jackie Joyner-Kersee
Students explore Jackie Jooyner-Kersee and how she's a motivator for people both as an athlete and a philanthropist.
Curated OER
Algebra: Olympic Races
Students use Olympic athlete statistics to make algebraic calculations. In this algebraic equation instructional activity, students use algebra to calculate athlete speed and calories burned.
Curated OER
Round The Track
Fourth graders develop problem solving skills while learning to measure an athletic track. The focus upon logic and reasoning is helpful for all types of science and math calculations.
Curated OER
Money Mathematicians
Students compete in a Money Math Olympics. Students work in teams to compete for speed and accuracy working math problems. Students keep track, in their math journals, of the number of problems solved accurately. Teams with the 3 highest...
Curated OER
6-8 Baseball Fun: Percentages, Decimals, and Fractions
Middle schoolers practice the concepts behind fractions, decimals, and percents by using sports statistics on baseball cards. In this baseball math lesson, students use fractions and estimation to calculate statistics. Middle schoolers...
Curated OER
Computer Olympics
Learners compete to achieve excellence in math facts, writing terms, problem solving, and writing skills on the computer. In this Computer Olympics lesson plan, students practice the skill of drill and practice in order to succeed and...
Virginia Department of Education
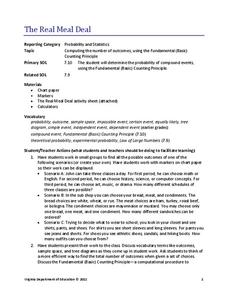
The Real Meal Deal
Burgers and salads and sodas, oh my! Scholars use a menu to investigate the Fundamental Counting Principle. They create tree diagrams to illustrate the number of possible choices for each given scenario.
Curated OER
The Distributive Property
Young scholars use a visual to introduce the Distributive Property. The lesson is chronologically numbered and follows a distinct plan. The class works with the teacher to complete the lesson. The plan is not written in a traditional...
Curated OER
Heart Rate Graphs
For this graphing worksheet, 5th graders use a line graph to compare and contrast the heartbeats of two athletes in a tennis match.
Federal Reserve Bank
To Rent-to-Own or Not to Rent-to-Own?
Explore the key elements of a contract with your young adults, and delve into the features and unique benefits of a rent-to-own contract through discussion and worksheet practice.
EngageNY
Calculating Conditional Probabilities and Evaluating Independence Using Two-Way Tables (part 1)
Being a statistician means never having to say you're certain! Learners develop two-way frequency tables and calculate conditional and independent probabilities. They understand probability as a method of making a prediction.
Curated OER
How Do You Spend Your Money?
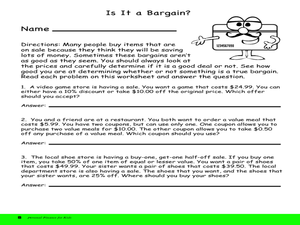
Fifth graders examine ways to save and spend money. They look at ways that people earn, save, and spend money using chapters from Tom Birdseye's Tarantula Shoes. They add and subtract decimals to fill in a worksheet entitled, "Is It a...
Illustrative Mathematics
Offensive Linemen
Comparing college football teams, Division I is said to have heavier lineman than Division III. Your mathematicians are given data from two different divisions and will have to interpret a dotplot and calculate the difference in weight...
EngageNY
Solving Equations Involving Linear Transformations of the Coordinate Space
Explore methods for solving linear systems with your classes and introduce learners to using matrices as a viable method. Scholars are able to recognize situations where matrices are the efficient method of solving. Application questions...
Curated OER
Exploring Height with Abe Lincoln
Students examine a life-size count out of Abraham Lincoln to get a visual comparison of their height and Lincoln's. They work in pairs and trace each other's body and measure from head to toe in inches using a ruler. They then subtract...
Curated OER
Winter Olympics History Year by Year
Investigate the history of the Winter Olympic Games. After researching this event and compiling necessary statistics, pupils use a graphic organizer to chart their findings. A template for a chart is included in this resource. Have your...
Curated OER
Y-Intercept and Slope Intercept Form
Alegebra amateurs identify the slope and the y-intercept given a linear equation in slope-intercept form by correctly completing some in class problems. They write the linear equation in slope-intercept form that corresponds to the given...
Illustrative Mathematics
Runners' World
Learners must investigate the validity of a claim made in a running magazine. They must identify and look up unprovided information, make appropriate estimations, and be able to convert units. Might be best used as a group or whole-class...
Willow Tree
Data Sampling
Some say that you can make statistics say whatever you want. It is important for learners to recognize these biases. Pupils learn about sample bias and the different types of samples.
Kenan Fellows
Applying Linear Regression to Marathon Data
It's not a sprint, it's a marathon! Statistic concepts take time to develop and understand. A guided activity provides an opportunity for individuals to practice their linear regression techniques in spreadsheet software. The activity...


