Curated OER
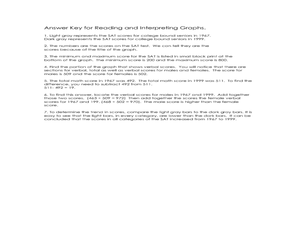
Reading and Interpreting Graphs Worksheet
In this bar graphs worksheet, students read and interpret a bar graph on SAT scores by answering short answer questions. Students complete 7 questions total.
Curated OER
Problem Solving: Use a Graph: Problem Solving
In this bar graph worksheet, students read the word problem and use the bar graph to complete the problem solving questions for understand, plan, solve, and look back.
Curated OER
Data and Graphs
In this data and graphs worksheet, students complete multiple choice questions about which bar graphs represent the data given and complete a bar graph based on data given. Students complete 3 problems.
Curated OER
Seized Before Flights: Graph
In this bar graph learning exercise, middle schoolers analyze a graph that show the number of prohibited items intercepted at U.S. airport screening checkpoints. Students answer 3 problem solving questions about the data on the graph.
Curated OER
Statistics Problems
In this statistics worksheet, 3rd graders answer questions about different graphs including bar graphs, picture graphs, line graphs, and more. Students complete 20 multiple choice questions.
Curated OER
7th Grade Math Worksheet
In this integers worksheet, 7th graders solve 10 different problems that include various types of integers and graphs. First, they determine the sum of 3 consecutive integers. Then, students find the ratio between 2 areas of similar...
Curated OER
Professor Panda's Pizza Graph
In this data analysis worksheet, students answer 11 questions using a bar graph that was constructed from the answers to a survey about pizza toppings. They use a secret code to determine the best place to have a pizza.
Curated OER
Graph Groups
In this graphing activity, 3rd graders create their own bar graphs. students study the pictures shown and complete 5 graphs beside each picture.
Curated OER
Graph Groups (One Color)
In this graphing learning exercise, learners solve 5 problems in which the colored shapes in each set are counted. Students then fill out a bar graph to show how many of each color are in the sets.
Curated OER
Surveying and Graphing- Favorite Character in Charlotte's Web
In this math and literature worksheet, students survey classmates about their favorite character in Charlotte's Web and display the data on a bar graph. The blank graph is unlabeled; there are no lists of characters to choose from.
Curated OER
Trumpet of the Swan Favorite Character Graph
For this math and literature worksheet, learners survey classmates about their favorite character in the book Trumpet of the Swan. Students display the data on this blank bar graph.
Mathed Up!
Tallys and Charts
After watching a brief instructional video, young mathematicians are put to the test. By completing and reading frequency tables, tally charts, and bar graphs, individuals show their understanding of how to interpret data.
Curated OER
Favorite Fruit
In this graphing instructional activity, 1st graders create a bar graph showing the favorite fruits of their classmates. They analyze their bar graph by answering five comprehension questions.
Curated OER
Baster Bonnets Sold
In this graphing learning exercise, students look at a bar graph and answer questions. Students review a graph showing the number of Easter bonnets sold by color and number. Students then answer five questions about the graph. Students...
Curated OER
Super Bowl Champs
In this Super Bowl worksheet, learners create line plots of all winners and losers of the Super Bowl. They create stem-and-leaf plots, scatter plots, and bar graphs of football data. This one-page worksheet contains...
Curated OER
Tally and Graph
In this survey and graphing worksheet, students take a survey of 10 friends by asking them to vote for their favorite musical instrument. They fill in a tally chart, track the tally marks, and develop a bar graph with the information.
Curated OER
Learning to Read Graphs
For this learning to read graphs worksheet, students look at the graph showing children's favorite colors, then write how many children like each of the 4 colors.
Illustrative Mathematics
Puppy Weights
Nobody can say no to puppies, so lets use them in math! Your learners will take puppy birth weights and organize them into different graphs. They can do a variety of different graphs and detail into the problem based on your classroom...
Curated OER
Fall Leaves
In this fall leaves learning exercise, students identify the colors of leaves and determine the number they have of each. This learning exercise may be used in elementary grades, for color identification and counting purposes. For the...
Curated OER
Frequency, Histograms, Bar Graphs
In this statistics worksheet, students plot and graph their data, then interpret the data using the correct form of graphs. There are 3 detailed questions with an answer key.
California Education Partners
Colorful Data
Scale up your lessons with a performance task. Young data analysts work through an assessment task on scaled bar graphs. They answer questions about a given scaled bar graph on favorite colors, analyze a bar graph to see if it matches...
Yummy Math
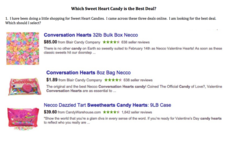
Which Sweet Heart Candy Is the Best Deal?
Get the most Valentine's candy for your money with a fun math activity! After examining three deals for buying candy hearts in bulk, young mathematicians decide which deal is the best and use bar graphs to demonstrate their claim. They...
Balanced Assessment
Cost of Living
Math scholars investigate the cost of living in Hong Kong compared to Chicago but must first convert the different types of currency. They then choose a type of graph to compare different spending categories and finish the activity by...
Curated OER
Make a Bar Graph
In this bar graphs worksheet, students use the tally chart to make a bar graph. Students color one box for each tally mark and then use the chart to help answer the questions about the sunny, cloudy, and rainy days.
Other popular searches
- Skittles Bar Graph
- Double Bar Graphs
- Bar Graphs Pictographs
- Histogram and Bar Graph
- Bar Graphs and Histograms
- Bar Graph Problem Solving
- Favorite Food Bar Graph
- Bar Graphs Histograms
- Interpreting Bar Graphs
- Bar Graphs for Birthdays
- Bar Graph Worksheet
- Bar Graphs and Charts


