Curated OER
Build a Skittles Graph
Students construct a bar graph with a given set of data. They calculate the ratio and percent of the data. Students discuss alternate ways of graphing the data as well as multiple strategies to approach the task.
Curated OER
Real Misleading Graphs
Students identify real graphs and misleading graphs. For this algebra lesson, students surf the Internet for real life scenarios where graphs are used in a misleading way as well as in a correct way.
Curated OER
Which Shape Do You Like Best?: Graph
In this favorite shape graph, students will ask their classmates which shape they prefer. There are 7 shapes from which to choose. Then students will record the responses to complete the bar graph.
Curated OER
How Did You Get To School Today?: Graph
In this transportation bar graph worksheet, students will ask their classmates how they got to school and record responses to complete the graph.
Curated OER
Which Graph is best?
Students use commercial software to organize and visually display data to draw conclusions; students use graphing software to create several types of graphs illustrating the number of each color of M&M's in one bag.
Curated OER
Favorite Sports Graph
In this data collection and graph worksheet, students ask each classmate which sport is their favorite based on the ones shown at the bottom of the graph. They color a square for each response, and tell the most and least popular sport.
Curated OER
John's Trucking - Who Drove the Farthest
In this bar graph activity, students fill in a chart of who drove the furthest each day of the week based on a bar graph. Students complete the chart and answer 2 questions.
Curated OER
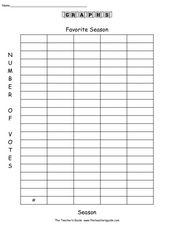
Favorite Season
In this graphing worksheet, students conduct a survey of people's favorite survey. They then complete 8 questions about the data gathered before creating a bar graph and pictograph on templates.
Curated OER
Graphs Review
Seventh graders review different types of graphs such as bar graphs, line graphs, box & whisker plots. As a class, they read a story and construct graphs to solve the data in the story. Students play "Graph Jeopardy" which requires...
Curated OER
Tallest Waterfalls of the World: Graph It
In this graphing worksheet, 6th graders graph the tallest waterfalls of the world according to which region they are located in. Students then answer questions related to their graph information.
Curated OER
Graphing on the Computer
Learners create a bar graph on the computer using given information from the teacher. They create a bar graph using their own information chart (they need to create one on separate paper first). They utilize Microsoft Excel for this lesson.
Curated OER
Aerosol Lesson: Science - Graphing SAGE II Data
Students examine and plot atmospheric data on bar graphs.
Curated OER
Data Analysis and Probability
Students make their own puzzle grid that illustrates the number of sit-ups students in a gym class did in one minute, then they make a histogram for this same data. Then they title their graph and label the scales and axes and graph the...
Curated OER
Mass/Weight/Data/Graphing-What Is The Mass of a Dinosaur?
Students determine the mass of various "dinosaur eggs" and graph their data. In this mass, weight, data and graphing lesson plan, students measure the mass of different weighted "dinosaur eggs". They record their data and transfer it to...
Curated OER
Fairy Tales
Sixth graders explore the elements of fairy tales. In this fairy tales lesson, 6th graders analyze several versions of Cinderella from around the world. Students graph fairy tale elements using Excel and create Venn diagrams comparing...
Curated OER
Social Studies Strategies: Attribute Graph
In this exploring an attribute graph worksheet, students read information and observe an attribute graph about Cinderella, and complete a bar graph about the attributes of a historical figure or climax of events. Students complete one...
Curated OER
World Oil Reserves: Assignment
Understanding and analyzing data is a critical skill. Included here are three worksheets a list of countries with the largest oil reserves, a graph of the same, and an assignment. The class uses their data to create a bar chart then...
Curated OER
Investigation - The M & M Mystery
Sixth graders inspect M&M's to complete statistical data. Students interpret percent of colors represented. They convert data from decimals, fractions, and percents. Using the data, 6th graders create a bar graph and a circle graph.
Curated OER
Daily Weather Calendar
Young learners will love this fun weather activity that incorporates math, science and writing. Each member of your class gets a turn becoming a meteorologist! At the end of recess, the two chosen meteorologists met the teacher at a...
DK Publishing
Using Information in Tables
Find out how well can your second or third graders use tables to solve word problems by assigning this single-page worksheet. Two tables with different sets of data prompt learners to solve six problems. An example at the top of the page...
Baylor College
Global Atmospheric Change: The Math Link
Change up the classroom atmosphere with this interdisciplinary resource. Following along with the children's book Mr. Slaptail's Curious Contraption, these math worksheets provide practice with a wide range of topics including simple...
CK-12 Foundation
Graphs for Discrete and for Continuous Data: Discrete vs. Continuous Data
Not all data is the same. Using the interactive, pupils compare data represented in two different ways. The learners develop an understanding of the difference between discrete and continuous data and the different ways to represent each...
Curated OER
Bar Graphs Using M & Ms
Fifth graders observe an overhead of a graph on which M & Ms have been poured out. A volunteer comes up and separates the colors writing on the overhead how many there were of each color and another person labels the graph's title....
Curated OER
SkittleGraphs
Second graders discover how to make a bar graph. Each student receives a bag of Skittles candy. They make a bar graph which documents the colors found in the bag. At the end of the lesson, the Skittles are eaten. Fun!


