Curated OER
RCX Car Line Graph
Students develop a line graph based on distances that an RCX car drives in specified amounts of time. They then are given a specific amount of time for the car to drive and be asked to extrapolate the car's distance from the graph.
Curated OER
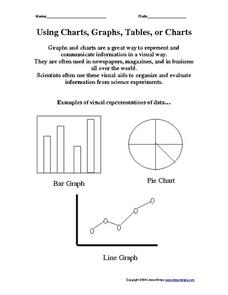
Using Charts, Graphs, Tables, or Charts
In this charts, graphs and tables activity, students view 3 different types of visual representations of data, make a list of 20 items and decide how the items can best be put together in groups to make a graph, chart or table. Students...
Curated OER
Creating Circle Graphs with Microsoft Excel
Students create graphs of circles. In this geometry lesson, students use Microsoft Excel to create graphs. They construct the graphs using paper and pencil as well as the computer.
Curated OER
Problem Solving: Use a Graph 3
In this math problem solving worksheet, students examine a graph based on books read and use it to solve 2 problem solving questions and a test prep question.
Curated OER
Statistics of Mars
Students explore the concept of central tendencies. In this central tendencies lesson, students sort M&M's or Skittles based on color. Students graph their results. Students find the mean, median, and mode of their data.
Curated OER
Graph Groups (Two Colors)
For this graphing worksheet, students count the colors of the shapes given to them, and put them into a graph representing a bar graph. Students complete 5 problems.
Curated OER
Graphing Groups
In this graphing worksheet, students graph sets of colored shapes, using a pair of bar graphs beside each set. A reference web site is given for additional activities.
Curated OER
Using Spreadsheets and Graphs
Third graders explore mathematics by utilizing computers. In this graphing lesson, 3rd graders gather class data based on a particular topic such as the "favorite candy" of the class. Students utilize this information and computers to...
Curated OER
What's Up With My Class
Learners collect data about their class and they use Excel spreadsheet to display their tables and graphs about the class. They answer survey questions and collect their data. Students create a graph of their choice to display the...
Curated OER
Sweet Data
Young scholars input data about the colors of their serving of M&M candies onto a spreadsheet. They create charts and graphs based on this information.
Curated OER
Bald Eagle Population Graphing
Young scholars create graphs to illustrate the bald eagle population. They identify the population of bald eagles in Minnesota and the United States. They create three graphs to represent the population data including a line, bar, and...
Math Moves U
Collecting and Working with Data
Add to your collection of math resources with this extensive series of data analysis worksheets. Whether your teaching how to use frequency tables and tally charts to collect and organize data, or introducing young mathematicians to pie...
Noyce Foundation
Granny’s Balloon Trip
Take flight with a fun activity focused on graphing data on a coordinate plane. As learners study the data for Granny's hot-air balloon trip, including the time of day and the distance of the balloon from the ground, they practice...
Museum of Tolerance
Why is This True?
Are wages based on race? On gender? Class members research wages for workers according to race and gender, create graphs and charts of their data, and compute differences by percentages. They then share their findings with adults and...
Shodor Education Foundation
Conic Flyer
Graphing conics made easy. Individuals use an interactive to graph conic sections. The app can handle circles, vertical and horizontal parabolas, ellipses, and vertical and horizontal hyperbolas.
Shodor Education Foundation
Multi-Function Data Flyer
Explore different types of functions using an interactive lesson. Learners enter functions and view the accompanying graphs. They can choose to show key features or adjust the scale of the graph.
Learner
Solid Shapes
A collection of two lessons, kindergartners will identify two-dimensional shapes in solid shapes. They will develop basic knowledge of the components that make up a sphere, rectangular prism, pyramid, cylinder, cone, and cube. Young...
CPO Science
Science Worksheets
If you need an array of worksheets to augment your science lessons, peruse a collection of assignments that is sure to fit your needs. With topics such as metric conversion, the scientific method, textbook features, research skills,...
US Department of Commerce
Featured Activity: Population Change Over Time
Keep track of a state's population. After a brief discussion on how population data is used for funding, individuals look at population changes over time. Pupils find the population of two states using three different censuses. They then...
American Statistical Association
The Taste of Yellow
Does lemonade taste better when yellow? A tasty experiment has scholars determine the answer to the question. It requires conducting a taste test with lemonades of different colors (from food coloring), and then collecting and analyzing...
Curated OER
Dr. Seuss Blank Graph
In this literature worksheet, students use a blank bar graph grid to record all of the Dr. Seuss books they read. No labels are on the graph.
Curated OER
Speed + Graphing = Winners!
Fifth graders take addition timed tests every day for a two week period. Using the data from the timed tests, they create a bar graph using Microsoft Excel computer software, a personal bar graph using graph paper and colored pencils,...
Curated OER
Jim, Tony, and Frank - The School Fundraiser
In this bar graph worksheet, students use the horizontal bar graph to count how much money each student collected for their fundraiser. Students answer 10 questions.
Curated OER
The Bread Shop
In this bar graphs worksheet, learners study the bar graph to count the money Adam made during each day. Students answer 10 questions.


