Curated OER
Smarties Pictogram and Bar Chart
In this math worksheet, students create a bar chart to illustrate the number of Smarties they have in each color. Students also draw a pictogram to represent the same information.
Curated OER
Word Problems and Bar Models
In this word problems instructional activity, students solve word problems using bar models about money, days on a farm, and more. Students complete 6 problems total.
Curated OER
Draw the Bar Lines
In this draw the bar lines worksheet, students draw the bars lines needed to create measures of music in the 5 lines of sheet music provided.
Curated OER
Family Activity: Bar Graphs and Line Graphs
In this math worksheet, students work at home with a family member on a graphing activity. Students count the number of cans, glass jars, boxes and bags in the pantry. Students make a bar and a line graph to represent the data.
Curated OER
Draw the Bar Lines
In this bar line recognition music learning exercise, students decide on the meter signature, if it is missing, and draw the bar lines that are missing.
Curated OER
Making A Horizontal Bar Graph
In this bar graph worksheet, students create a bar graph to display 6 scores from basketball games. Students will label the x and y axis and correctly plot the scores from the table provided.
Curated OER
Horizontal Bar Graph: Changes in Nebraska Population
In this bar graph learning exercise, students learn about the changes in Nebraska's population from 1880 to 2000 by studying a bar graph. Students answer 7 questions about the graph.
Curated OER
Animal Runners
In this collecting data worksheet, 4th graders use the data shown on how fast 6 animals can run to create a bar graph. Students follow the instructions on 3 directives for their bar graphs and answer 1 short answer question.
Curated OER
Graphs - Online Activity
In this interpreting graphs worksheet, students complete an on-line activity in which they read both a line graph and a bar graph. They answer questions about how many of each letter is shown on a line graph and how many of each child's...
Curated OER
Endangered Species
In this geography worksheet, high schoolers identify how to manipulate data on a range of endangered species. They create a bar graph of endangered animals from Africa, Asia, Australia, North America, or South America. Students use a...
Curated OER
Graphs to Represent a Data Set
Here are the number of animals Jackson saw at the zoo; scholars organize data into bar graphs using this learning exercise. Encourage labeling, but consider having scholars do these on another sheet because there isn't room for the...
National Security Agency
Going Green with Graphs
In this unit designed for second graders, youngsters are introduced to conducting surveys and creating tally charts based on the data they gather. Students then construct bar graphs, and observe the relationships between the two types of...
Curated OER
Draw the Bar Lines
In this bar line recognition sheet music worksheet, students read the sheet music provided and draw the bar lines that are missing.
Curated OER
Draw the Bar Lines
For this bar line recognition sheet music worksheet, students read the sheet music provided and draw the bar lines that are missing.
Curated OER
Draw the Bar Lines
In this bar line recognition sheet music worksheet, students read the sheet music provided and draw the bar lines that are missing.
Mathed Up!
Tallys and Charts
After watching a brief instructional video, young mathematicians are put to the test. By completing and reading frequency tables, tally charts, and bar graphs, individuals show their understanding of how to interpret data.
Curated OER
Number Bonds Bars
Ten divided bars are given for students to practice number bonds. They will create all number bonds for ten, as well as write the corresponding equation. This would be a fantastic worksheet to complete with unifix cubes.
Curated OER
Fractions: pie graphs, numbers, and bars
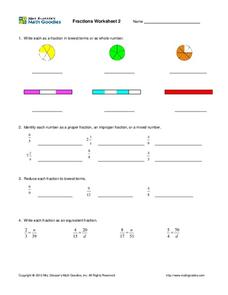
In this fraction worksheet, middle schoolers complete fraction problems containing pie graphs, numbers, bars, proper fractions, lowest terms, and more. Students complete 19 problems.
Curated OER
Graphs: Number of Cans Collected
Who collected the most recyclables? Learners read the vertical bar graph and answer the eight questions that follow. Review the terms fewer and combined before sending your class on its way.
David Pleacher
Candy Math Fun
Few things can motivate children to learn like the promise of a sweet and tasty treat. Given a bag of M&M®s, Skittles®, or other colorful candy, students first predict the contents of the bag before counting the pieces, creating a...
EngageNY
Interpreting and Computing Division of a Fraction by a Fraction—More Models II
No more inverting and multiplying to divide fractions. Applying concepts of measurement division from the previous lesson, pupils consider partitive division using fraction bars and number lines. They first convert fractions to like...
Curated OER
Graphs: Students in Math Classes
Are your second and third graders just beginning to read bar graphs? This graph looks at the number of learners present in a math class Monday-Friday. Learners look for basic information, and the graph is easy to read.
Curated OER
Measure and Color
In this nonstandard measurement worksheet, young mathematicians look at the height of each of four lines, then color in the measurement bars up to the right height to match each line.
Curated OER
Food for Class Party
In this interpreting a bar graph and math word problems worksheet, 2nd graders read the information about choices of food for a class party and answer various multiple choice questions. Students solve 25 problems.
Other popular searches
- Fraction Bars
- Hershey Fraction Bars
- Fractions With Chocolate Bars
- Candy Bars
- Fractions With Hershey Bars
- Math Comparison Bars
- Measurement Bars
- Fractions Fraction Bars
- Fractions and Fraction Bars
- Hersey Bars
- Integer Bars
- Make Fraction Bars


