Curated OER
Data and Graphs
For this data and graphs worksheet, learners complete multiple choice questions about which bar graphs represent the data given and complete a bar graph based on data given. Students complete 3 problems.
Curated OER
Graphs
In this bar graph activity, students answer questions for a bar graph that is about students taking part in a math class. Students complete 6 problems total.
Curated OER
Graphs
In this bar graph worksheet, 6th graders complete word problems based on a bar graph of number of cans of food collected. Students complete 8 problems.
Curated OER
Money: At the Burger Bar
In this money worksheet, students use a list of food costs at a burger bar to find the cost of given items. An answer key and reference website are included.
Curated OER
Surveying and Graphing- Favorite Character in Charlotte's Web
In this math and literature worksheet, students survey classmates about their favorite character in Charlotte's Web and display the data on a bar graph. The blank graph is unlabeled; there are no lists of characters to choose from.
Curated OER
Trumpet of the Swan Favorite Character Graph
In this math and literature worksheet, students survey classmates about their favorite character in the book Trumpet of the Swan. Students display the data on this blank bar graph.
Curated OER
Write Larger Numbers in Words or Figures
In this reading a bar graph worksheet, students identify numbers to answer word questions. In this short answer worksheet, students answer five questions.
Curated OER
Histograms: Practice
In this histograms learning exercise, students use the bar graph histogram to answer questions 1-4 and the tally chart for question 5. Students finish with two test prep questions.
Curated OER
Frequency Tables and Histograms
In this graph worksheet, 5th graders study the data presented on a bar graph. Students then respond to 4 short answer questions using the information that has been provided.
Curated OER
Seized Before Flights: Graph
In this bar graph worksheet, students analyze a graph that show the number of prohibited items intercepted at U.S. airport screening checkpoints. Students answer 3 problem solving questions about the data on the graph.
Curated OER
Graph Groups (One Color)
In this graphing worksheet, students solve 5 problems in which the colored shapes in each set are counted. Students then fill out a bar graph to show how many of each color are in the sets.
Curated OER
Graph Groups
In this graphing worksheet, 3rd graders create their own bar graphs. students study the pictures shown and complete 5 graphs beside each picture.
Curated OER
Bluebird Eggs in Nestbox chart
In this bluebird eggs worksheet, learners fill out the chart which resembles a bar graph on how many eggs each bluebird has and answer short answer questions. Students answer 5 questions.
Curated OER
Graphs
In this graphs worksheet, students complete word problems about a bar graph of tickets sold for the drama club. Students complete 8 problems.
Curated OER
Fourth Grade Mathematics Quiz
For this math worksheet, 4th graders complete multiple choice questions about multiplication, bar graphs, rounding, and more. Students complete 15 questions.
Curated OER
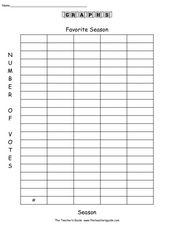
Favorite Season
In this graphing worksheet, students conduct a survey of people's favorite survey. They then complete 8 questions about the data gathered before creating a bar graph and pictograph on templates.
Curated OER
Leveled Problem Solving: Choosing and Analyzing Data Displays
In this using a bar graph to solve word problems worksheet, students choose and analyze data to problem solve. Students solve six problems.
Curated OER
Problems to Solve
In this solving word problems activity, students read a word problem with an example of drawing a bar model to solve and use them to solve word problems. Students solve three multi-step problems.
Curated OER
Skittle Math
In this skittle math worksheet, students sort skittles by color and create a bar graph for each color of skittle. Students also answer comparison, ratio, and relationship questions about the skittles.
Curated OER
Are Yellow, Green, Or Red Apples Your Favorite To Eat?-- Class Bar Graph
In this math worksheet, students collaborate to complete a bar graph about favorite apples. Students plot the information from their class on a simple bar graph.
Curated OER
What Do You Like on Top of Your Pizza Most? --class Bar Graph
In this math worksheet, students participate in completing a bar graph as a class. Students survey classmates as to their favorite pizza toppings and plot the results on this bar graph.
Curated OER
How Do You Like Your Sandwich? --class Bar Graph
For this math worksheet, students participate in a group bar graph activity. Students survey their classmates on favorite sandwich choices: peanut butter and jelly, grilled cheese or meat. Results are plotted on a bar graph.
Curated OER
How Many Brothers And Sisters Do You Have? -- Class Bar Graph
In this math learning exercise, students collaborate in generating a class bar graph which displays information about how many brothers and sisters each classmate has. Data is plotted on a bar graph.
Curated OER
Which Kind of Weather Do You Like Best? -- Class Bar Graph
In this math worksheet, students generate a class bar graph. Classmates are surveyed about favorite weather: sunny, rainy, snowy, cloudy or windy. Results are displayed on a bar graph.
Other popular searches
- Fraction Bars
- Hershey Fraction Bars
- Fractions With Chocolate Bars
- Candy Bars
- Fractions With Hershey Bars
- Math Comparison Bars
- Measurement Bars
- Fractions Fraction Bars
- Fractions and Fraction Bars
- Hersey Bars
- Integer Bars
- Make Fraction Bars


