CK-12 Foundation
Evaluate Limits Using Graphs and Tables: Where Is That Limit?
Limits are made easy through graphs and tables. An easy-to-use interactive lets users change a function on a coordinate plane. They relate graphs and tables to the limit at a specific value.
CK-12 Foundation
Evaluate Limits Using Graphs and Tables: Evaluate the Limits
Discontinuities in the graph? No worries. Pupils investigate the limit of a function given graphically using an interactive. The graph has removable and jump discontinuities.
CK-12 Foundation
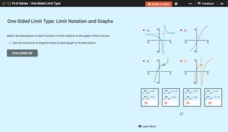
One-Sided Limit Type: Limit Notation and Graphs
A one-sided limit is no less important than a two-sided limit. Young mathematicians use an interactive to match limit notation to graphs. The exercise requires interpreting how one-sided limits connect to features of graphs.
CK-12 Foundation
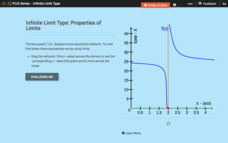
Infinite Limit Type: Properties of Limits
Limits can provide some valuable information about graphs. A slider interactive lets learners see the behavior of a graph around asymptotes. They investigate relationships between limits and asymptotes.
CK-12 Foundation
Infinite Limit Type: Evaluating Limits of Rational Functions
Rational functions become less mysterious when you know about limits. Individuals use an interactive to move a rational function on a coordinate plane and to investigate function values for certain x-values. They see how the limit...
CK-12 Foundation
Infinite Limit Type: Asymptotes and End Behavior Question
There are an infinite number of reasons to use the resource. Scholars drag vertical and horizontal lines to the graph of a rational function to identify all asymptotes. They investigate the connection between asymptotes and limits to...
CK-12 Foundation
Least-Squares Regression
Residual plots let you find the perfect line of best fit. As users adjust the points on a scatter plot and a possible line of best fit, the interactive automatically changes the residual plot. This change allows them to see connections...
CK-12 Foundation
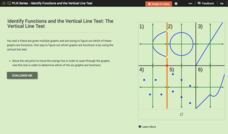
Identify Functions and the Vertical Line Test: The Vertical Line Test
There's no easier test than the vertical line test. Learners drag a vertical line across the graphs of several relations in an interactive. They answer a set of challenge questions that focus on whether the graphs represent functions.
CK-12 Foundation
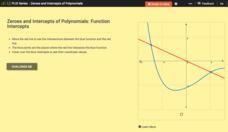
Zeroes and Intercepts of Polynomials: Function Intercepts
There is zero reason not to use the resource. Given a graph with a polynomial function and a linear function, scholars move the line in an interactive. To wrap up the lesson, they note how zeros and intersection points change.
CK-12 Foundation
Restricted Domain and Range: Restricted Circle Radius and Area
There's no restriction to how much your class can learn about domain and range. Users of an interactive adjust the radius of a circle to see its effects on the area. They note how restrictions in the domain (radius) relate to...
CK-12 Foundation
Restricted Domain and Range: Translation of a Curve
Moving the graph of a function obviously changes its domain and range. Scholars adjust the location of a graph in an interactive coordinate plane. The interactive automatically updates and displays the domain and range to show how it...
CK-12 Foundation
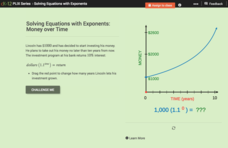
Solving Equations with Exponents: Money Over Time
We'd all like to see our money double. An interactive shows how an initial investment of $1,000 will increase using a constant rate of return. Scholars answer a set of challenge questions based on the situation.
CK-12 Foundation
Compound Interest per Period: Credit Card Payment
Credit cards can be convenient, but are they worth it? Future consumers learn about compound interest and credit card payments. They use an interactive to create a table that shows the remaining balance after each month.
CK-12 Foundation
Continuous Interest
Continue teaching your financial scholars about interest. A slider interactive has users investigate the growth of an account earning continuous interest. A set of challenge questions has them solve problems given a variety of situations.
CK-12 Foundation
APR and APY: APR vs. APY
Who wins the battle of the interest rates? Scholars use an interactive to investigate three different bank rates. Comparing APR and APY lets them see how nominal and effective rates differ.
CK-12 Foundation
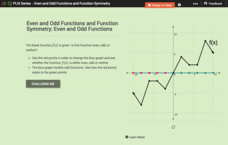
Even and Odd Functions and Function Symmetry: Even and Odd Functions
Even, odd, or neither? Pupils study even and odd functions using a well-balanced interactive. They determine whether a given function is even or odd from its graph.
CK-12 Foundation
Even and Odd Functions and Function Symmetry: Even and Odd Functions (Symmetry)
Even money states that the resource is good to use. Scholars manipulate an interactive to adjust the portion of a graph to the left of the y-axis. The interactive allows them to switch between even and odd modes that show the right side...
CK-12 Foundation
Find Imaginary Solutions: Imaginary Zeros
The resource is the real deal. Individuals investigate the imaginary zeros of f(x) = x^2 + 1. They accomplish this task by using an interactive that shows input values x = a + bi and output values x^2 + 1 on a complex plane.
CK-12 Foundation
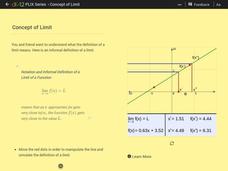
Concept of Limit
There's no limit to how useful the resource can be. Scholars use a slider interactive to investigate limits from graphs. They take both one-sided and two-sided limits into consideration.
CK-12 Foundation
Mode: Kittens
It is not as difficult as herding cats. The short interactive provides a group of kittens to sort according to their colors. Pupils determine the mode of the number of kittens by color. The questions continue with other numbers of...
CK-12 Foundation
Mode: Mucho Money
Generate stacks of money. Given bills of different denominations, pupils stack them based on their values. The learners figure out which value is the mode of the data and determine whether the data is unimodal, bimodal, or multimodal.
CK-12 Foundation
Mean: Harmonic Mean
Let the means live in harmony. With lengths representing the values of a small data set, learners compare the arithmetic mean to the harmonic mean. The pupils determine which value is the most accurate representation of the average of...
CK-12 Foundation
Mode: Boxes of Oranges
See how your data stacks up. Pupils stack crates of oranges in increasing order, creating a simple bar graph. Using the graph, individuals determine measures of center and describe the shape of the distribution. Scholars determine what...
CK-12 Foundation
Coefficient of Variation: Diverse Populations
What is the height of school clubs? Learners use sliders to calculate the coefficient of variation for three different school groups. Using the calculations, class members compare the variation in the heights of the groups.


