Thinkport Education
Thinkport: Algebra Ii: Linear, Quadratic and Exponential Regression
Review linear regression and analyze how well this model fits the data. You will also be introduced to residuals and the correlation coefficient, and use these tools to determine whether or not a linear model is the best fit for a set of...
CK-12 Foundation
Ck 12: Algebra: Linear Interpolation and Extrapolation
[Free Registration/Login may be required to access all resource tools.] Use linear interpolation, linear extrapolation, and the line of best fit to make predictions about a data set.
Math Is Fun
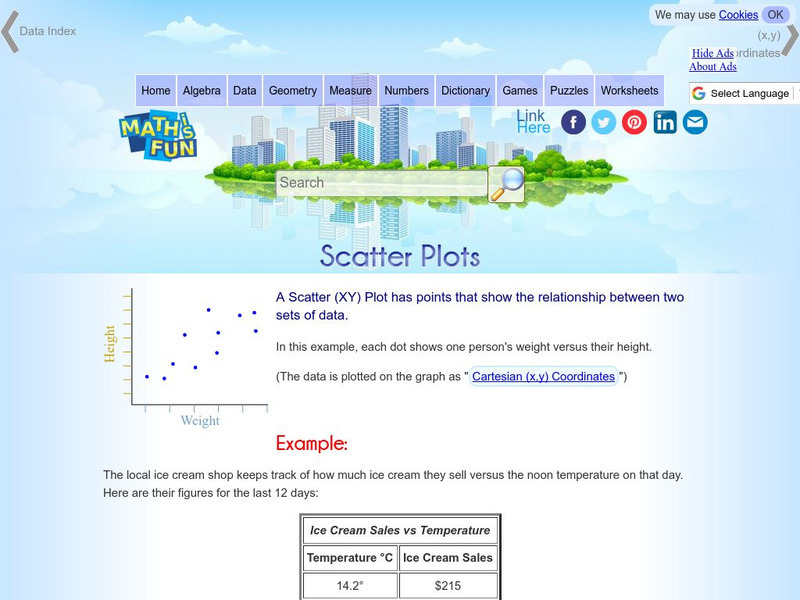
Math Is Fun: Scatter Plots
Explains, with examples, what scatter plots are and how to interpret the data. Discusses trends, interpolation and extrapolation, and correlation. Includes a set of practice questions.
Texas Instruments
Texas Instruments: Mc Dougal Littell Algebra 1: Perform Linear Regression
Students can use the TI-84 Plus family to enter data, do a scatter plot and find the line of best fit and explain how they could use it to predict future values.
CK-12 Foundation
Ck 12: Algebra: Applications of Function Models
[Free Registration/Login may be required to access all resource tools.] In this lesson students draw a scatter plot of data, find and draw the function that best fits that data, and make predictions from that information. Students watch...
Texas Instruments
Texas Instruments: Numb3 Rs: How Much Can They Win?
Based off of the hit television show NUMB3RS, this lesson has students create data points from given information, plot those points, and then create a line of best fit. This is done in the context of playing blackjack, although the...
Texas Instruments
Texas Instruments: A Wet Welcome Home Adventure 4
Students perform an experiment that simulates a leaking pipe and gather data on volume of water lost over time. They graph the data collected as a scatter plot, find the equation of the line of best fit, find the total volume of water...
Texas Instruments
Texas Instruments: A Sweet Drink Adventure 7
Students determine how the temperature of water affects the dissolving time of a sugar cube. They create, interpret and analyze graphs of data, find an equation of the line of best fit, and relate slope to rate of change.
Texas Instruments
Texas Instruments: What Is a Linear Regression?
In this activity, students create lists of data points, plot them on a graph, and determine the regression equation of the best fitting line. They also understand exactly how the linear regression is determined.
Rice University
Rice University: The Hand Squeeze
Students will enjoy this data collection and class analysis experiment involving the time it takes for a hand squeeze to travel around a circle of people. From organizing the activity to collecting the data to making a table and graphing...
Texas Instruments
Texas Instruments: The Phone Bill Problem
The student is given actual data and asked to find a line of best fit and to give "real world" interpretations of the slope and y-intercept. A great introduction to the 83/84 and its features.
Texas Instruments
Texas Instruments: Numb3 Rs: Less Is More
Based off of the hit television show NUMB3RS, this two-part lesson begins by having students try to find the line of best fit for a given set of data (strike outs vs. home runs). The second part of the lesson shows how least squares...
Texas Instruments
Texas Instruments: Burning Volumes
An analysis of how the volume of various jars impacts the burning time of candles. Data collected will be used to explore modeling, line fitting and linear regression Using graphing calculators.
Other
Stat Soft: Statistics Glossary
Dozens of statistical terms are defined and illustrated in this glossary.
Texas Instruments
Texas Instruments: Using Regression Functions
In this activity, students experiment with regression features of the calculator to find a best fit for a data set.
Physics Aviary
Physics Aviary: Quick Graph 3.0
This program was designed as a quick graphing program that students could use on a computer, tablet or smart phone when a more complex graphing program is not available. This program will let students plot up to 10 data points and then...


