Curated OER
The Swinging Pendulum
Students observe a pendulum and graph their observation. In this algebra instructional activity, students use the TI calcualtor to graph the motion the pendulum makes. They analyze the graph and make predictions.
Curated OER
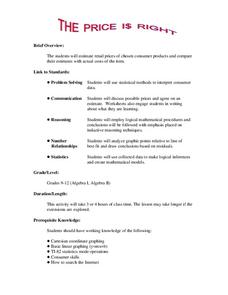
The Price Is Right
Students create a list of products with estimated prices. In this algebra lesson, students learn to write equations using variables. They match their created list with that of actual products and compare their prices,
Curated OER
Left Hand, Right Hand - Solving Systems of Equations
Students compare the speed at which they write with their left hand to the speed at which they write with their right hand. The experiment serves as a vehicle to help students develop a conceptual understanding of the three different...
Curated OER
Let's Graph It!
Students graph the height of others in centimeters and inches, find the slope of line in order to calculate the conversion factor between centimeters and inches.
Curated OER
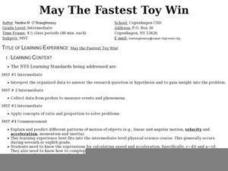
May The Fastest Toy Win
Students determine which wind-up toy is the fastest. However, they can NOT race the toys. They must find another way. On the first day of the activity, students work in pairs or small groups to develop and write a plan.
Curated OER
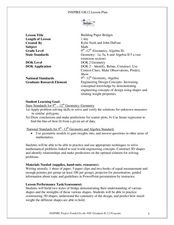
Building Paper Bridges
Students construct a bridge that can hold 100 pennies. In this math lesson, students evaluate the strength of their bridges. They predict how much weight a bridge can hold based on its design.
Khan Academy
Khan Academy: Estimating Equations of Lines of Best Fit and Making Predictions
Practice estimating the equation of a line of best fit through data points in a scatter plot. Then use the equation to make a prediction. Students receive immediate feedback and have the opportunity to try questions repeatedly, watch a...
Texas Education Agency
Texas Gateway: Modeling Data With Linear Functions
Given a scatterplot where a linear function is the best fit, the student will interpret the slope and intercepts, determine an equation using two data points, identify the conditions under which the function is valid, and use the linear...
Texas Education Agency
Texas Gateway: Collecting Data and Making Predictions
Given an experimental situation, the student will write linear functions that provide a reasonable fit to data to estimate the solutions and make predictions.
Texas Instruments
Texas Instruments: Use the Regression Feature to Find a Line of Best Fit
This tutorial shows you how to enter a set of data and find the line of best fit.
Khan Academy
Khan Academy: Estimating Slope of Line of Best Fit
Given a scatter plot, can you estimate the slope of the line of best fit that goes through the data points? Students receive immediate feedback and have the opportunity to try questions repeatedly, watch a video, or receive hints.
CK-12 Foundation
Ck 12: Scatter Plots and Linear Correlation
[Free Registration/Login may be required to access all resource tools.] This lesson covers plotting a scatterplot and finding a linear equation that best fits the data.
University of South Florida
Fcat: Bungee M&m's: Teacher Notes
Students will learn how to draw a line of best fit for a set of data using m&m's and a "Bungee."
University of South Florida
Fcat: Shaq's Hand/foot Span: Teacher Notes
Students compare their own hand/foot span to Shaquille O'Neal's, then graph the data & construct a best-fit line. They can then use the information to investigate the proportionality of the human body.
Texas Instruments
Texas Instruments: Linear Functions Modeled by Data
Students submit their own data that can be modeled by a linear function. Students find the line of best fit, and discuss graphs of linear functions.
TeachEngineering
Teach Engineering: The Challenge Question: "Walk the Line"
Students are introduced to the "Walk the Line" challenge question. They are asked to write journal responses to the question and brainstorm what information they need to answer the question. Ideas are shared with the class (or in pairs...
TeachEngineering
Teach Engineering: Walk the Line: A Module on Linear Functions
This module leads students through the process of graphing data and finding a line of best fit while exploring the characteristics of linear equations in algebraic and graphic formats. Then, these topics are connected to real-world...
Texas Instruments
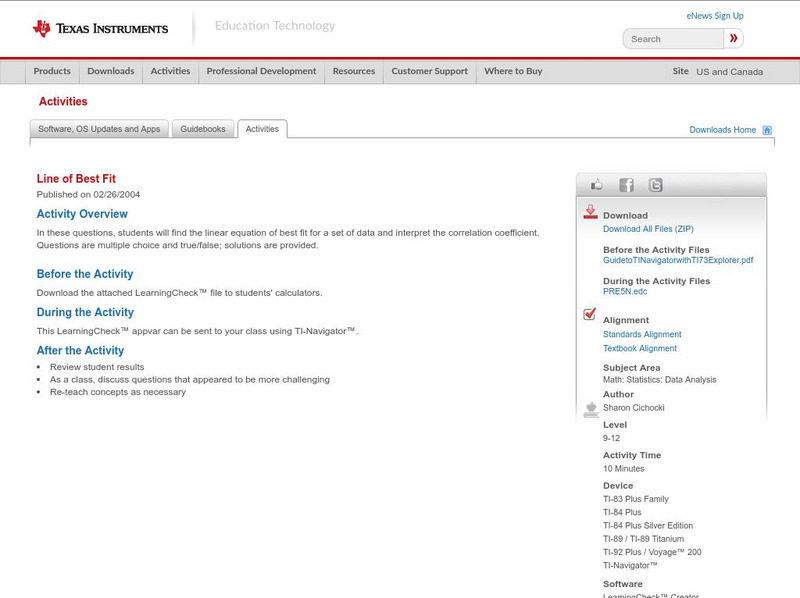
Texas Instruments: Line of Best Fit
In these questions, students will find the linear equation of best fit for a set of data and interpret the correlation coefficient. Questions are multiple-choice and true/false; solutions are provided.
University of Colorado
University of Colorado: Ph Et Interactive Simulations: Least Squares Regression
Create your own scatter plot or use real-world data and try to fit a line to it. Explore how individual data points affect the correlation coefficient and best-fit line.
Texas Education Agency
Texas Gateway: Tea Statistics: The Regression Equation
A tutorial on how to find the line of best fit or least-squares regression line for a set of data in a scatter plot using different methods and calculations.
National Council of Teachers of Mathematics
Nctm: Illuminations: Line of Best Fit
Use this applet to learn about a line of best fit for a set of data points. Some example data in this site include statistics from the 2004-2005 LA Lakers season. Students can guess the equation for a set of data points before the applet...
Varsity Tutors
Varsity Tutors: Hotmath: Practice Problems: Fitting Equations to Data
Five problems present practice using data to write equations and linear models. They are given with each step to the solution cleverly revealed one at a time. You can work each step of the problem then click the "View Solution" button to...
Texas Instruments
Texas Instruments: An Exploration of Direct Variation and Linear Regression
Students will use this activity for the following Algebra concepts: Review of Direct Variation; Properties of direct variations; Finding the constant of variations from data sets; Find missing values in data sets both numerically and...
University of Colorado
University of Colorado: Ph Et Interactive Simulations: Curve Fitting
Drag data points and their error bars, and watch the best-fit polynomial curve update instantly. Choose the type of fit: linear, quadratic, cubic, or quartic. The reduced chi-square statistic shows when the fit is good.


