Math Graphs
Houghton Mifflin: Math Graphs: Line of Best Fit 8 [Pdf]
The practice problem examines the line of best fit and a scatter plot. The scatter plot is available in PDF format.
Math Graphs
Houghton Mifflin: Math Graphs: Line of Best Fit 13 [Pdf]
Learners investigate the line of best fit and the regression feature of a graphing calculator. The example consists of a math graph with given points that are available in PDF format.
Math Graphs
Houghton Mifflin: Math Graphs: Line of Best Fit 14 [Pdf]
Students investigate the line of best fit and the regression feature of a graphing calculator. The example consists of a math graph with given points that are available in PDF format.
Math Graphs
Houghton Mifflin: Math Graphs: Line of Best Fit 15 [Pdf]
The practice problem explores the validity of the line of best fit and a linear regression model created on a graphing calculator. The given points are available in PDF format.
Math Graphs
Houghton Mifflin: Math Graphs: Line of Best Fit 16 [Pdf]
The practice problem explores the validity of the line of best fit and a linear regression model created on a graphing calculator. The given points are available in PDF format.
Math Graphs
Houghton Mifflin: Math Graphs: Line of Best Fit 19 [Pdf]
The exercise has learners create the line of best fit for the given points. The handout is available in PDF format.
Math Graphs
Houghton Mifflin: Math Graphs: Line of Best Fit 20 [Pdf]
The exercise has learners create the line of best fit for the given points. The handout is available in PDF format.
Other
Linear Functions, Slope and Regressions
Find activities here for linear functions, slopes and regression lines. Use them for classroom work or individual assignments.
Scholastic
Scholastic: Cultivating Data
Students will understand key concepts of data analysis and their graphic representations. Students will construct and interpret data tables, line plots, box-and-whisker plots and stem-and-leaf plots, scatterplots with line of best fit,...
University of South Florida
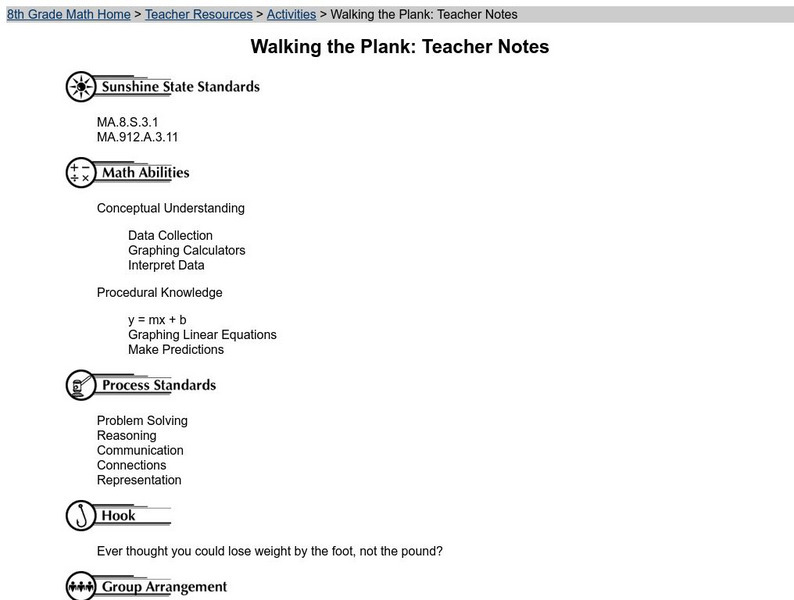
Florida Center for Instructional Tech: Walking the Plank
Students use weight to collect data and investigate the linear relationship. This activity uses a graphing calculator.
Texas Instruments
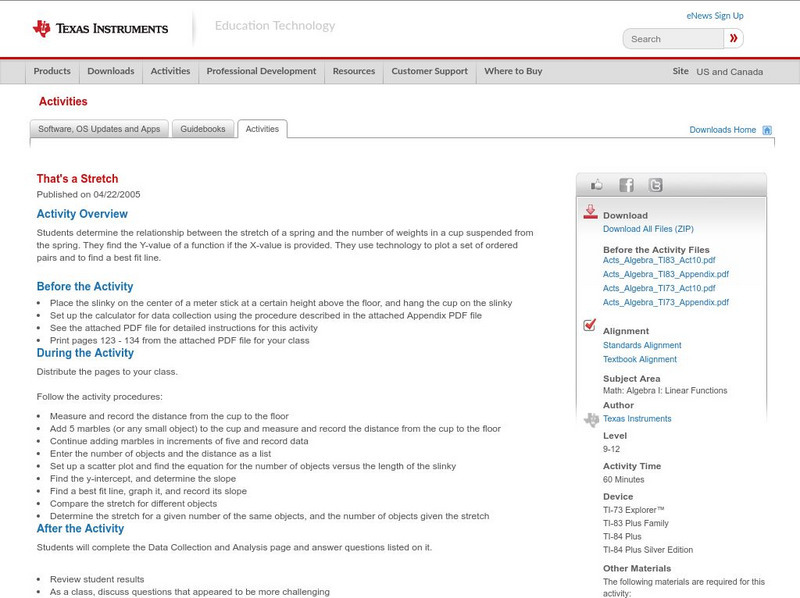
Texas Instruments: That's a Stretch Ti 83
Students determine the relationship between the stretch of a spring and the number of weights in a cup suspended from the spring. They find the Y-value of a function if the X-value is provided. They use technology to plot a set of...
Varsity Tutors
Varsity Tutors: Hotmath: Practice Problems: Fitting Equations to Data
Five problems present practice using data to write equations and linear models. They are given with each step to the solution cleverly revealed one at a time. You can work each step of the problem then click the "View Solution" button to...
Texas Instruments
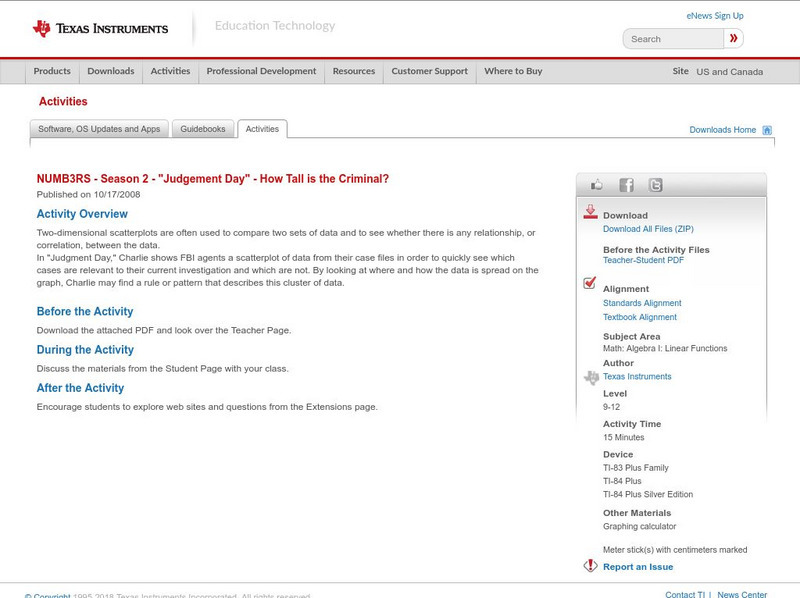
Texas Instruments: Numb3 Rs: How Tall Is the Criminal?
Based off of the hit television show NUMB3RS, this lesson introduces students to lines of best fit and their applications. While the extensions delve into correlation, the main lesson focuses only on collecting data, creating a...
Texas Instruments
Texas Instruments: Numb3 Rs: Dialing Ben
Based off of the hit television show NUMB3RS, this lesson has students try to discover if there has been a significant change in cell phone use over the course of ten days. If so, this "change point" can be detected by creating a line of...
Illustrative Mathematics
Illustrative Mathematics: 8.sp Laptop Battery Charge
This task looks at how long it takes for a laptop battery to fully charge. Students make a scatter plot of data, draw a 'line of best fit,' and predict the time it will take to reach a full charge. Aligns with 8.SP.A.2.
Math Graphs
Houghton Mifflin: Math Graphs: Line of Best Fit 3 [Pdf]
Students sketch the line that best approximates the data in a scatter plot. The scatter plot is available in PDF format.
Math Graphs
Houghton Mifflin: Math Graphs: Line of Best Fit 4 [Pdf]
Learners sketch the line that best approximates the data in a scatter plot. The scatter plot is available in PDF format.
Other
Honolulu Community College: Galileo's Kinematics
In this experiment you will attempt to reproduce Galileo's results using the inclined plane. You will test three hypotheses relating to motion on an incline. You will learn to draw a "best fit" or regression line of experimental data....
Texas Education Agency
Texas Gateway: Modeling Data With Linear Functions
Given a scatterplot where a linear function is the best fit, the student will interpret the slope and intercepts, determine an equation using two data points, identify the conditions under which the function is valid, and use the linear...
CK-12 Foundation
Ck 12: Scatter Plots and Linear Correlation
[Free Registration/Login may be required to access all resource tools.] This lesson covers plotting a scatterplot and finding a linear equation that best fits the data.
University of Regina (Canada)
University of Regina: Math Central: Scatter Plots
Three different concepts are examined about scatter plots. Topics featured are collecting data, analyzing scatter plots, and determining a line of "best fit". The lesson has an overview, material, procedures, and evaluation techniques.
University of Regina (Canada)
University of Regina: Math Central: Scatter Plots
Three different concepts are examined about scatter plots. Topics featured are collecting data, analyzing scatter plots, and determining a line of "best fit". The instructional activity has an overview, material, procedures, and...
University of Regina (Canada)
University of Regina: Math Central: Scatter Plots
Three different concepts are examined about scatter plots. Topics featured are collecting data, analyzing scatter plots, and determining a line of "best fit". The lesson has an overview, material, procedures, and evaluation techniques.
University of Regina (Canada)
University of Regina: Math Central: Scatter Plots
Three different concepts are examined about scatter plots. Topics featured are collecting data, analyzing scatter plots, and determining a line of "best fit". The lesson has an overview, material, procedures, and evaluation techniques.
Other popular searches
- Line of Best Fit
- Lines of Best Fit
- Math Best Fit Line
- Best Fit Linear Data
- Algebra Line of Best Fit
- Best Fit Line Worksheets
- Best Fit Linear Data"
- Correlation Best Fit Lines
- Graphing Best Fit Linear Data


![Houghton Mifflin: Math Graphs: Line of Best Fit 8 [Pdf] Unknown Type Houghton Mifflin: Math Graphs: Line of Best Fit 8 [Pdf] Unknown Type](https://d15y2dacu3jp90.cloudfront.net/images/attachment_defaults/resource/large/FPO-knovation.png)


