Curated OER
Graph Frenzy!!
Students brainstorm for a survey question to ask classmates. They survey their classmates. They enter the results into a spreadsheet and create the best graph for the information. They share their graphs with the class.
Curated OER
Vocab-u-lous! Build a Fabulous Vocab: Words Beginning with O
In this vocabulary worksheet, students select the best word to complete the sentence. They are challenged by the difficult words that begin with "o."
Curated OER
Linear Functions-Learn Your Lines
Students solve and graph linear equations. In this algebra lesson, students collect and plot data on a coordinate plane. They use the CBL and TI calculator to graph systems of equation.
Curated OER
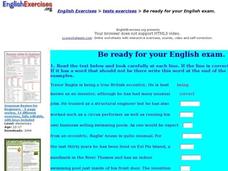
Be ready for your English exam
In this reading worksheet, students read each line and at the end of the line they write "correct" if the line is correct and if there is a word that should not be there, they write that word. Students complete this for 15 lines and then...
Curated OER
Strike a Pose: Modeling in the Real World (There's Nothing to It!)
Adjust this lesson to fit either beginning or more advanced learners. Build a scatter plot, determine appropriate model (linear, quadratic, exponential), and then extend to evaluate the model with residuals. This problem uses real-world...
Kenan Fellows
Least Squares Linear Regression in R
The task? Determine the how effective hospitals are at reducing the rate of hospital-acquired infections. The method? Data analysis! Using an open source software program, individuals use provided data and create scatterplots to look for...
Learning to Give
Teaching Playwriting in Schools
The world is a stage, and so is your classroom! Hone the skills of the next generation of Tony® award winners with a set of exercises, reference pages, writing prompts, and excerpts from famous plays.
Curated OER
SAT Problem Solving Practice Test
In this problem solving practice test, students select the best answer from 4 choices to ten questions. Questions are word problems and cover a variety of topics.
Curated OER
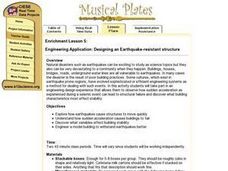
Designing an Earthquake-resistant Structure
Students attempt to design and build the most stable "earthquke resistant" structure. They create model buildings and test them on a shake table to see which design holds up the best.
Curated OER
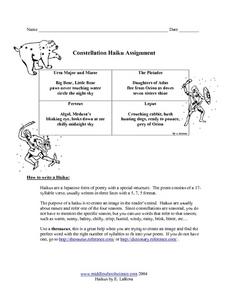
Constellation Haiku Assignment
In this constellation haiku worksheet, students create a poem with a 17-syllable verse that paints a picture about a constellation. They use words that refer to the seasons since constellations are seasonal. Students can use a thesaurus...
Dick Blick Art Materials
EZ-Grout Mosaics
Young artists create 2-D art using air-dry clay and acrylic paint in this mosaic-making activity. Kids trace their design sketch on a clay slab, cut out the pieces, and after drying, paint and mount their tile design.
101 Questions
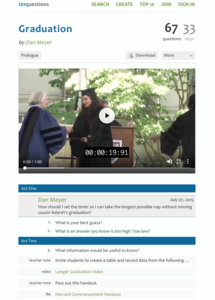
Graduation
Graduation ceremonies are huge milestones, but sometimes waiting for a name to be called gets a bit boring. Scholars find the pace the announcer calls names to determine how long until a specific name is called. Calculations work in...
Curated OER
Numerical Analysis: Introduction to Approximation Theory
In this introduction to approximation theory, students compute the slope and intercept of a line. They describe nonlinear relationships. This four page activity contains approximately five problems.
Curated OER
Linear Systems: Least Squares Approximations
In this least squares approximation worksheet, students use linear algebra to find the least square error and the equation of a line for given points. They find the equation of a parabola through provided points. This four-page...
Curated OER
Discovering the Linear Relationship between Celsius and Fahrenheit
Students discover the linear relationship between degrees Farenheit and degrees Celsius. They manually compute the slope and y-intercept of the line passing through points. They convert Celsius to Fahrenheit degrees.
Curated OER
Investigating Linear Equations Using Graphing Calculator
Learners investigate linear equations using the Ti-Calculator. In this algebra lesson, students graph lines and identify the different quadrants on a coordinate plane. They identify ordered pairs used to plot lines.
Curated OER
Rocketsmania And Slope
Students use a professional basketball team's data and graph it on a coordinate plane. They draw a line of regression and finding its equation. They access a website containing statistics for the Houston Rockets basketball team to solve...
Curated OER
How Do They Relate? Linear Relationship
Students collect information and use a line to represent it. In this algebra activity, students investigate real world data to see if it makes a line. They graph the line comparing the relationship of the x axis with that of...
Curated OER
Modelling Periodic Phenomena
In this Pre-calculus/Trigonometry worksheet, students determine the trigonometric function that best models the given data. The eight page worksheet contains explanation, examples, and twenty-one problems. Answers are not included.
Curated OER
Means of Growth
Learners collect and graph data. In this statistics lesson, students analyze their plotted data using a scatter plot. They identify lines as having positive, negative or no correlation.
Curated OER
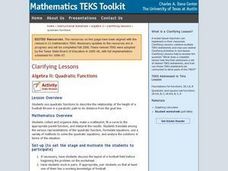
Algebra II: Quadratic Functions
Students collect and organize data, make a scatterplot, fit a curve to the appropriate parent function, and interpret the results. Students translate among the various representations of the quadratic function, formulate equations, use a...
Curated OER
"Strike a Pose:" Music and Vogueing in The Winter's Tale
Students read Shakespeare's The Winter's Tale. In groups, they "perform" Act 3, Scenes 1-3 by "striking a pose" that best depicts the characters in that scene and by bringing in music that would best accompany the scene.
Curated OER
Notorious Confusables
For this similar words worksheet, learners complete a 10 question multiple choice on-line interactive quiz about words that are easily confused. Students choose the best word to complete each sentence from 2 similar words. Example:...
Curated OER
Let's Graph It!
Students graph the height of others in centimeters and inches, find the slope of line in order to calculate the conversion factor between centimeters and inches.
Other popular searches
- Line of Best Fit
- Lines of Best Fit
- Math Best Fit Line
- Best Fit Linear Data
- Algebra Line of Best Fit
- Best Fit Line Worksheets
- Best Fit Linear Data"
- Correlation Best Fit Lines
- Graphing Best Fit Linear Data


