Curated OER
TV Tells it All
Students discuss the concept of gender bias and stereotyping. In this social science lesson, students determine what the influence of television on gender roles represents and compares the chage in gender roles of today to those of their...
Curated OER
Alphabet Soup Job Descriptions
Eleventh graders investigate New Deal programs. In this Great Depression lesson, 11th graders read the provided source materials that detail the agendas of 3 New Deal agencies. Students complete the provided analysis sheets and then...
Curated OER
Be the Kiwi: Gender Roles
Students take a look at gender roles in New Zealand. In this global issues lesson, students analyze statistics that reveal the divide between men and women employees in the country.
Anti-Defamation League
Is Gaming a Boy's Club? Women, Video Games and Sexism
High school juniors and seniors investigate the representation of women in video games. They watch a video of researcher Anita Sarkeesian who describes the response to her research attempts, and read articles related to the topic. To...
Curated OER
Texas Industries Then and Now
Students identify contemporary economic counterparts to industries featured in Texas bird's-eye views by using this website and a "Goods and Services Data Collection Sheet."
Curated OER
Linear Patterns in Data
Eighth graders extend their learning of graphing linear equations and are introduced to connecting patterns in tables and graphs to represent algebraic representations. They then determine patterns and extrapolate information from these...
Illustrative Mathematics
Why Randomize?
Your statisticians draw several samplings from the same data set, some randomized and some not, and consider the distribution of the sample means of the two different types of samplings. The exercise demonstrates that non-random samples...
Curated OER
Scientific Approach to Forest Management
Students use wireless laptop computers to collect, store, communicate, and organize data from the 1999 Jasper Fire area. They collect data in the field and compare it to student-collected data from prior years to develop conclusions...
Curated OER
One, Two, Three...and They're Off
Students make origami frogs to race. After the race they measure the distance raced, collect the data, enter it into a chart. They then find the mean, median, and mode of the data. Next, students enter this data into Excel at which time...
Curated OER
The Significant Contributions of Islamic Women to the Growth and Expansion of Islamic Civilization
Students read and explore the historical evidence that supports the viewpoint that Islamic women have made significant and lasting contributions to Islamic Civilization. They read and analyze secondary and primary sources relevant to...
Curated OER
Suspect Sources at the Republican Debate
Students review statements made during a 2007 Republican presidential for factual references. They research the statements for accuracy using internet resources. Students also examine the stated purpose of the websites used to fact check...
University of North Carolina
Evaluating Print Sources
Not all sources are created equal, so how do you evaluate them? Writers learn how to evaluate print sources based on elements such as audience, tone, and argument in the sixth handout of 24 in the Writing the Paper series from the...
Curated OER
Exploring Racism in America
Students compare racism today to racism that existed during the nineteenth century. As a field research project, students individually keep track of examples of racism, biases, and stereotypes illustrated throughout the US media over a...
Curated OER
Palpating Pachyderms: How Do We Interpret Observations?
Students interpret a poem before completing activities to distinguish observations and interpretations. They examine how personal background can influence how a person interpreters what they observe.
College Board
2008 AP® Statistics Free-Response Questions Form B
To know what is on the test would be great. The six free-response question from the second form of the 2008 AP® Statistics gives pupils an insight into the format and general content of the exam. Each question requires the test...
PBS
Amid Rising Economic Inequality, Does America Need a Third Reconstruction?
Young political scientists investigate the Poor People's Campaign protest held in Washington, D.C., on June 18, 2022. They research how the event was reported in various news outlets and consider their stance on whether...
Curated OER
Holes
Students distinguish between primary and secondary sources when researching on the Internet and evaluating historical records. They recognize important features of a primary source such as the type of document, who created it, what is...
Curated OER
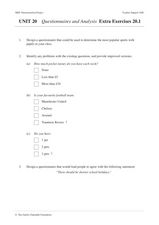
Unit 20 Questionnaires and Analysis Extra Exercises 20.1
In this statistics worksheet, students design a biased questionnaire. They create data displays based on given statistics. There are a total of 9 problems.
Curated OER
Handling Data: Probability
Fourth graders find and justify probabilities and approximations. In this repeating experiment, 4th graders complete a worksheet after rolling die and tossing coins to determine outcomes.
Curated OER
Samples and Stats
Students explore different methods of taking surveys and conducting polls and examine these methods for bias. They design and administer a sample survey, analyze the data and present their findings to the class.
C-SPAN
Polling and Public Opinion
Most people are eager to offer their opinions about topics of interest, but what's the most effective way to collect and assess these opinions as a matter of fact? High schoolers learn about the history of polling, as well as the...
Curated OER
Childhood Obesity
Students identify a question to generate appropriate data and predict results. They distinguish between a total population and a sample and use a variety of methods to collect and record data. Students create classifications and ranges...
Curated OER
Polling and Statistics
Learners investigate polling. In this statistics lesson, students collect data-on polling and graph their data on a coordinate plane. They identify biased and non-biased polling.
Curated OER
If the World Was a Village...Examining Ethnocentrism
Seventh graders examine their own perceptions of world's people, compare those perceptions to real demographic data, provide definition and understanding of term "ethnocentrism," and examine their own ethnocentrism based on comparison of...


