Curated OER
Candy Machine
Using the concept of a candy vending machine, young mathematicians explore the sugar ratios found in different types of candy. Using the provided information, class members calculate and compare different ratios in order to find the...
University of Georgia
Density and Texture of Soil
All soil is not created equal! A lab activity asks learners to collect and analyze soil. Specific calculations determine the amount of sand, silt, and clay in a sample and allow individuals to identify the soil texture.
Florida International University
Counting FishStix
How do we count the fish in the ocean? An engaging lesson models how to estimate fish populations with observational surveys. Class members begin by studying the behavior of fish on the coral reef in the oceans. They then become the fish...
Cornell University
The Galvanic Cell Game
Play a little game with your classes! Young scholars expand on their understanding of oxidation/reduction reactions in a game-based activity. They build a Galvanic cell with game pieces while learning about each component and their...
Cornell University
Thinking with the Eyes
Objects are larger (or smaller) than they appear! Scholars use a laboratory investigation to explore the difference between resolution and magnification. The activity allows them to calculate the size of the field of view of their light...
American Statistical Association
Chunk it!
Chunking information helps you remember that information longer. A hands-on activity tests this theory by having learners collect and analyze their own data. Following their conclusions, they conduct randomization simulations to test...
Illustrative Mathematics
How Many Leaves on a Tree?
This is great go-to activity for those spring or fall days when the weather beckons your geometry class outside. Learners start with a small tree, devising strategies to accurately estimate the leaf count. They must then tackle the...
Curated OER
Button Bonanza
Collections of data represented in stem and leaf plots are organized by young statisticians as they embark some math engaging activities.
Mathematics Assessment Project
Representing Probabilities: Medical Testing
Test probability concepts with an activity that asks pupils to first complete a task investigating false positive in medical testing and then to evaluate sample responses to the same task.
Mathematics Assessment Project
Funsize Cans
Designing fun-size cans ... what fun! Class members use the provided questions to determine the dimensions of a can with a minimum surface area for a given volume. The task allows learners to use graphs or algebraic manipulation to solve...
Noyce Foundation
Rabbit Costumes
How many rabbit costumes can be made? This is the focus question of an activity that requires scholars to use multiplication and division of fractions to solve a real-world problem. They determine the amount of fabric necessary for eight...
Beauty and Joy of Computing
Building Your Own Blocks
Isn't building with blocks an activity for toddlers? The third lab of a five-part unit teaches young computer scientists how to create their own block instructions for programming. They use these blocks to create geometric figures, spell...
National Institute of Open Schooling
Solid State
Crystal comes from a Greek word meaning ice. Activity eight in a series of 36 has class members analyzing amorphous and crystalline solids and further classifying them based on their forces. They then explore solids, learning about unit...
Curated OER
The Pythagorean Theorem Lesson 2
Learners discuss and review examples of the Pythagorean Theorem using a GSP, Geometer's Sketchpad, activity.
Curated OER
Measure: Perimeter, Area and Volume
Learners practice measuring with formulas. For this measurement lesson, students complete an activity that requires them to calculate perimeter, area, and volume.
Curated OER
Dollar Word
Students review the value of coins prior to adding up values to equal one dollar. Letters of the alphabet are assigned monetary values and students use calculators to add up the value of a word. Students work with a partner to try and...
Teach Engineering
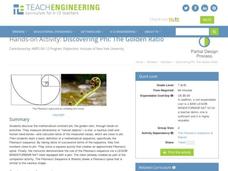
Discovering Phi: The Golden Ratio
Fe, phi, fo, fum. This activity leads pairs to find the ratio of consecutive terms of the Fibonacci sequence. The pairs find that the Fibonacci sequence can be found in many places. A discussion with the class shows that the ratios found...
MENSA Education & Research Foundation
Roller Coaster Mania!
Raise the energy level of your physical science class with this exciting hands-on activity. Applying their knowledge of kinetic and potential energy and Newton's laws of motion, young engineers use foam tubing and marbles to create...
Curated OER
The Crash Scene
Fifth graders explore geography by participating in a mapping activity. In this engineering lesson, 5th graders identify the differences between latitude and longitude and practice locating precise points on a globe or map. Students...
Curated OER
Consumer Borrowing and Spending
Credit can be confusing for teens, some of whom are already using credit cards. Clear up misconceptions with this group research activity which has a solid outline with a lot of room to adjust to your needs and resources. Groups are...
Curated OER
Frame Yourself
Young ratio masters calculate and cut a frame (out of poster board) to accurately create an even frame around a picture of themselves. The frame needs to be proportional to the picture with constraints determined by the instructor.
Illustrative Mathematics
Rectangle Perimeter 3
This activity looks at writing expressions to represent perimeter of a rectangle and then considers the concept of equivalent expressions and the distributive property in more detail.
Curated OER
The Closer I Get To You
Pupils explore the law of reflection. Through experimentation and problem solving, they collect and analyze data pertaining to reflection. The data is plotted on a graph and formulas for calculating the x and y values are evaluated.
Curated OER
The Shortest Line Mystery
Students calculate the shortest distance of various scenarios. In this algebra lesson, students interpret graphs of optimization problems. They use a graphing calculator to assist them in graphing and making predictions.


