Alabama Learning Exchange
Polygons-Changing Area Versus Changing Perimeter
Investigate the area and perimeter of polygons in this geometry lesson. Young geometers use grid paper to draw a quadrilateral and calculate its area and perimeter. They also read The Greedy Triangle to identify the changing shape of...
Curated OER
How Much, How Fast, How Far?
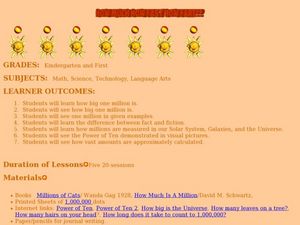
Students investigate the concept of the number one million. In this number concepts lesson, students read the book How Much is a Million? and brainstorm questions, such as "how many leaves are on a tree" and "how many hairs are on your...
Curated OER
Area and Perimeter Floor Plan
Using Google SketchUp, learners draw a model of their bedroom. They begin by measuring the dimensions of their bedroom, inputting this information into the software program, and calculating perimeter and area. This is an interesting and...
Bowland
Design the Mascot
Explore how resizing an object affects its area. The set of lessons challenges young mathematicians to design a mascot for electronic devices. These designs undergo resizing to determine how scale factors of dilation affect area.
Polar Trec
Down to the Deep Virtual Lab
At a depth of 3,000 m in the ocean, the pressure is 300 times that at sea level! In the activity, individuals predict what will happen to Styrofoam cups submerged 3,000 meters into the ocean. They then convert these units to soccer...
Education World
Got the Time? (Math Word Problems)
Upper graders work with peers to solve word problems related to time and independently solve word problems that involve calculating time. They will show their ability to solve and work through mathematical operations. A worksheet is...
Curated OER
Drawing to Scale
Students examine the process of drawing a picture to scale. They analyze and discuss real-life blueprints for a house, and create a scale drawing of an original invention using calculators and rulers.
College at Brockport
Healthy Ecosystems
Is there a connection between the snowshoe hare population and the lynx population? Young scientists will examine this question and graph actual data to determine the relationship between these two species, as well as researching another...
Curated OER
Interest Rates
Use a KWL chart and discussion to explore the concept behind loans with interest based on percentage rates. Learners examine different types of interest, the history of interest loans and calculate the costs of a loan over a ten-year...
Pennsylvania Department of Education
Build What I've Created
n this geometric lesson, students define and identify two dimensional shapes based on their attributes. They complete worksheets based on the geometric concepts.
Curated OER
Mean in Statistics: Practice Finding Averages
Using an online, interactive practice exercise, learners calculate the mean of six sets of numbers. A handy tool to provide practice or assess mastery. Immediate feedback notes correct responses and leaves incorrect ones in place so...
Texas Instruments
Function Notation - Texas Instruments
Using a TI-Nspire calculator, learners will work to better understand function notation and input/output functions. They write equations with a function symbols, identify what makes an equation a function, and graph lines in order to...
Curated OER
Voter Turnout
Explore politics by analyzing the voting process. Pupils discuss the purpose of casting votes in an election, then examine graphs based on the data from a previously held election's turnout. The activity concludes as they answer study...
Curated OER
When Will We Ever Use This? Predicting Using Graphs
Here are a set of graphing lessons that have a real-world business focus. Math skills include creating a scatter plot or line graph, fitting a line to a scatter plot, and making predictions. These lessons are aimed at an algebra 1 level...
Statistics Education Web
When 95% Accurate Isn’t
Investigate the effect of false positives on probability calculation with an activity that asks scholars to collect simulated data generated by a calculator. To finish, participants analyze the probability of certain outcomes which lead...
Mathematics Vision Project
Module 1: Getting Ready Module
This fabulous resource is a must-have for any algebra teacher's arsenal of lessons. Developing the idea of equations and use of variables from basic physical scenarios, learners gain valuable intuition in the structure and meaning of...
Curated OER
Geometry Project
Proofs are usually an intimidating assignment. An engaging lesson focused on geometric proofs may reduce the anxiety! Pupils choose between several triangle proofs to complete and work on completing them. The assignment also gives a...
SaveandInvest.org
The True Cost of Owning a Car
Almost every teen wants a car, but can they really afford one? The lesson walks pupils through how to identify a budget, find all of the costs associated with car ownership, and determine if they should buy the car or keep looking.
PBL Pathways
Medical Insurance
Design a plan for finding the best health insurance for your money. Learners compare two health plans by writing and graphing piecewise functions representing the plan rules. Using Excel software, they create a technical report...
Teach Engineering
Scale Model Project
Try your hand at scale models. Scholars create a scale model of an object using a scale factor of their choice. As part of the project, they give presentations on their processes and calculations. This is the last installment of the...
Curated OER
Pedometer Activities to Enhance Cross-curricular Learning
Learners complete different activities involving pedometers such as writing a creative story, calculating step averages, researching pedometers, calculating calories, and much more.
Math12
Conditional Probability
Conditional probability can be a confusing concept. A straightforward lesson provides reasonable examples of conditional probability, and models the most effective ways to reinforce the more complex parts of the lesson.
EngageNY
Applying Tangents
What does geometry have to do with depression? It's an angle of course! Learners apply the tangent ratio to problem solving questions by finding missing lengths. Problems include angles of elevation and angles of depression. Pupils make...
Alabama Learning Exchange
Building Functions: Reverse to Inverse
Reverse the wrapping to get to the gift. Using the idea of unwrapping a gift, the lesson introduces the concept of inverses. Pupils first determine the order needed to evaluate a function at a point, then use the reverse to find the...


