Other
Minitab: Comparison of Categorical and Quantitative Variables
This resource explains the difference between categorical and quantitative variables and provides examples of each.
Illustrative Mathematics
Illustrative Mathematics: Favorite Ice Cream Flavor
The purpose of this task is for students to represent and interpret categorical data. As a class, students will answer a question with three possible answers and construct a bar graph with the responses. Multiple discussion questions and...
Texas Instruments
Texas Instruments: Exploring Probability
In this activity, students learn to create a categorical list, then convert their data into a pie chart, and use it to answer questions.
Other
Stat Soft: Statistics Glossary
Dozens of statistical terms are defined and illustrated in this glossary.
Khan Academy
Khan Academy: Bar Graphs Review
Bar graphs are a nice way to visualize categorical data. This article reviews how to create and read bar graphs.
Khan Academy
Khan Academy: Picture Graphs (Pictographs) Review
Picture graphs are a fun way to display data. This article reviews how to create and read picture graphs (also called pictographs).
Science Education Resource Center at Carleton College
Serc: Adventures at Dry Creek
This educational module enables students (5-12) to experience ongoing research of University of California paleontologists studying about life in Montana 60-70 million years ago. It gives students the opportunity to experience the...
University of Cambridge
University of Cambridge: Maths and Sports: Who's the Best?
Can you use data from the 2008 Beijing Olympics medal tables to decide which country has the most naturally athletic population? This data-handling activity encourages mathematical investigation and discussion and is designed to be...
ABCya
Ab Cya: Panic in Pet Paradise
It's pandemonium at Pet Paradise Hotel! The picky pets are quite particular about where they are staying. Can you figure out the puzzle correctly so that each dog, cat, mouse and bird is happy?
Hunkins Experiments
Hunkin's Experiments
This amazing website provides access to 200 exciting experiments from cartoonist, broadcaster, and engineer, Tim Hunkin. Each experiment is categorized and illustrated.
Khan Academy
Khan Academy: Two Way Tables Review
Two-way tables organize data based on two categorical variables.
Climate Literacy
Clean: A Fossil Thermometer
In this activity, students calculate temperatures during a time in the geologic record when rapid warming occurred using a well known method called 'leaf-margin analysis.' Students determine the percentage of the species that have leaves...
TeachEngineering
Teach Engineering: Environment
Through 10 lessons and more than 20 hands-on activities, students are introduced to the concept of an environment and the many interactions within it. As they learn about natural and human-made environments, as well as renewable and...
Khan Academy
Khan Academy: Two Way Frequency Tables
Given a Venn diagram or information about a relationship, create a two-way frequency table. Students receive immediate feedback and have the opportunity to try questions repeatedly, watch a video, or receive hints.
Khan Academy
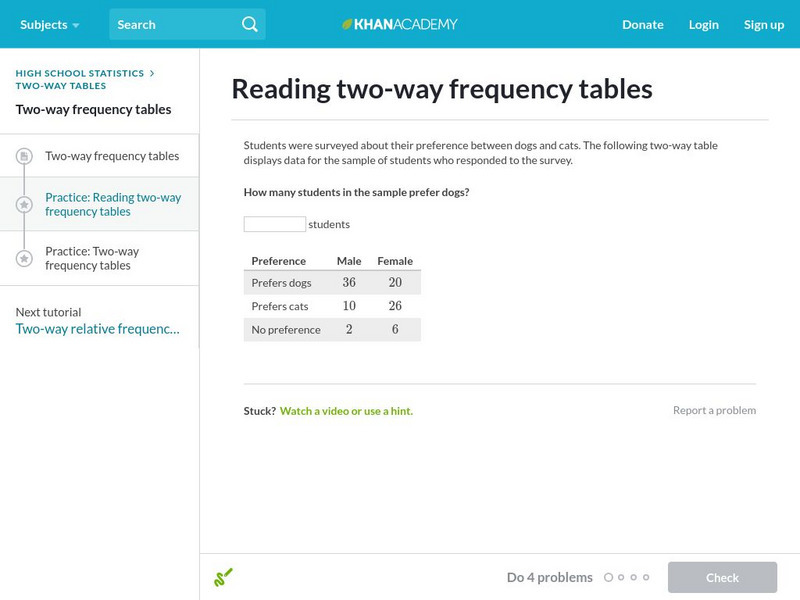
Khan Academy: Reading Two Way Frequency Tables
Practice interpreting two-way frequency tables. For example, what does the cell in the top left tell you? Students receive immediate feedback and have the opportunity to try questions repeatedly, watch a video, or receive hints.
Khan Academy
Khan Academy: Conditional Distributions and Relationships
A small private college was curious about what levels of students were getting straight A grades. College officials collected data on the straight A status from the most recent semester for all of their undergraduate and graduate students.
Illustrative Mathematics
Illustrative Mathematics: N q.a.3 and S id.a: Accuracy of Carbon 14 Dating I
This task examines, from a mathematical and statistical point of view, how scientists measure the age of organic materials by measuring the ratio of Carbon 14 to Carbon 12. The focus here is on the statistical nature of such dating....
TeachEngineering
Teach Engineering: Touch and Discover
Students work in pairs or small groups to identify and categorize various objects. One student is blindfolded and the other student chooses five objects for their partner to identify. The blindfolded student has to describe and try to...
Richland Community College
Richland Community College: Stats Graphs Defined
Richland Community College provides a glossary of many terms that are needed in order to understand statistics graphs and charts. Each of the types of charts is quickly explained in terms of what it is most effective in displaying.
Khan Academy
Khan Academy: Two Way Relative Frequency Tables and Associations
A set of three problems where students fill in a relative frequency table, read the information in it and look for a relationship between the variables. Answers are accompanied by explanations.
Other popular searches
- Categorical Data Worksheet
- Classify Categorical Data
- Numerical vs. Categorical Data
- Numerical vs Categorical Data


