Teach Engineering
Start Networking!
Class members create their own social networks by collecting signatures before graphing the interactions with their fellow classmates. The degree distribution of the simulated social network is determined by calculating the degree of...
Curated OER
Let's Graph It
In this let's graph it worksheet, student interactively answer 10 multiple choice questions about graphing data and types of graphs, then click to check their answers.
Curated OER
Where Have All the Endangered Gone?
Students explore animals that are endangered. They choose an endangered animal that they would like to keep from becoming extinct. Students create a persuasive presentation to persuade someone to understand why they feel keeping their...
Curated OER
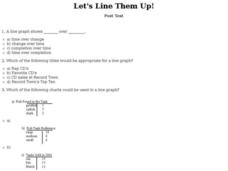
Let's Line Them Up! Post Test
In this line graphs worksheet, students answer multiple choice questions about line graphs. Students complete 10 multiple choice questions.
Curated OER
Multiplying Fractions
In this general mathematics worksheet, students multiply fractions, including whole numbers and mixed numbers. The one page interactive worksheet contains five problems. Solutions and answers are provided.
Curated OER
Graph Made Easy: Post Test
In this graphs worksheet, students answer multiple choice questions about line graphs and bar graphs. Students answer 10 questions total.
Curated OER
Seized Before Flights: Graph
In this bar graph worksheet, students analyze a graph that show the number of prohibited items intercepted at U.S. airport screening checkpoints. Students answer 3 problem solving questions about the data on the graph.
Curated OER
Centipede's 100 Shoes
Students solve equations with the help of their teacher. In this simple equations activity, students listen to the story Centipede's 100 Shoes by Tony Ross and use the scenarios given in the book as addition and subtraction problems....
Curated OER
Survey Project
Eighth graders create a website using FrontPage. They use inserted forms to collect survey information and use Microsoft Excel and MS Word to create a presentation of the survey and the results.
Curated OER
Bias in Statistics
Students work to develop surveys and collect data. They display the data using circle graphs, histograms, box and whisker plots, and scatter plots. Students use multimedia tools to develop a visual presentation to display their data.
Curated OER
Trees For Trout!
Fourth graders determine the impact of native forests, local clearcuts and local clearcuts and local reforestation projects on the survivablity of Rainbow Trout in their area. They record and document the stages of the trout throughout...
Curated OER
Outbreak!
Eleventh graders explore the spread of a disease through a population. In this Algebra II lesson plan, 11th graders analyze graphical data representing they spread of a disease. Students produce a graph of the virus data, analyze the...
Curated OER
Twenty-Eight Multiple Choice No Calculator Allowed AP Calculus BC Practice Exam
In this AP Calculus BC practice exam, learners solve twenty-eight multiple choice problems without the use of a calculator. This worksheet should be completed in fifty-five minutes.
Curated OER
AP Calculus Practice Exam
For this Calculus worksheet, students are provided with problems of a similar nature to those on their exam. Problems include limits, derivatives, and integrals. The four page worksheet contains twenty-eight problems. Answers are not...
Curated OER
Putting Your Best Foot Forward
Third graders measure their feet and their parents' feet, record data on computer-generated graphs, and calculate and record mean, median, and mode.
Curated OER
Population Demographics: Our Aging World
Students examine the impact of the aging population. In this demographic instructional activity, students evaluate, analyze, and make predictions about the aging world around them.
Curated OER
Let's Graph It! Pre-Test
In this graphing worksheet, students complete a set of 10 multiple choice questions, clicking on a link to see correct answers or print the page.
Curated OER
Distributive Property
Students solve problems using distribution. In this algebra lesson plan, students factor equations using the distributive property. They graph their solution on a graph.
Curated OER
Graph Logarithms
Mathematicians graph logarithmic equations. Teach your students how to identify the intercepts of logarithmic equations and tell whether the function is increasing or decreasing. They find the domain and range of each function.
Curated OER
Infusing Equity Vs Gender into the Classroom
Students explore the effect of gender bias in the classroom. In this statistics lesson, students discuss the effects of stereotyping, discrimination, and gender bias in the classroom. They collect data on different work places dealing...
Curated OER
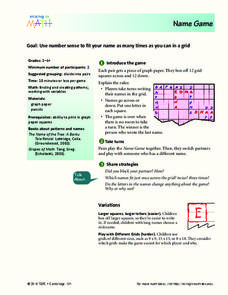
Name Game
Students practice writing names using a Scrabble type activity. In this letter writing lesson, students participate in a name writing game in which they must utilize other student names to spell their own on the same grid. Students...
Curated OER
Leaving on A Jet Plane
Students create an airplane by listening to directions. They also to measure the pieces for the airplane and compare and contrast their test flights.
Curated OER
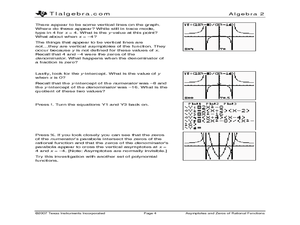
Asymptotes and Zeros
Learn how to explore rational functions and investigate the graphs rational functions and identify its singularities and asymptotes. High schoolers approximate the solutions to rational equations and inequalities by graphing.
Curated OER
Religious Book Sales Climb
In this analyzing data worksheet, students review a graph from the USA Today. Students study the graph and answer four questions about the graph. There are also two extension questions included.


