Captain Planet Foundation
Frog Garden Party! Toads and Triangles in the Math Garden
It's frog party time! With frog banners, frog juice, and a triangle hunt, your garden party is sure to be both entertaining and educational. The lesson connects geometry, earth science, and delicious snacks to teach kids about ecosystems...
Curated OER
The Consumer Price Index: A Measure of Inflation
Students examine inflation over the years and learn to calculate how it changes over time. In this money management lesson, students learn how price changes affect their purchasing power, how to come up with strategies for dealing with...
Curated OER
Making & Breaking : The Rock Cycle
Middle schoolers examine the rock cycle and how rocks can change over time. In this geotechnical engineering lesson students draw a diagram of the rock cycle.
Curated OER
Iditarod Math Challenge
In this Iditarod worksheet, students complete word problems about the money, booties, time, and more about the Iditarod. Students complete fifteen problems.
Curated OER
Demography of Roosevelt Over Time
Students examine how the demographics of their high school have changed over time. After collecting and graphing data, they write their conclusions. They share their analysis with the class and compare them with others.
EngageNY
Graphs of Simple Nonlinear Functions
Time to move on to nonlinear functions. Scholars create input/output tables and use these to graph simple nonlinear functions. They calculate rates of change to distinguish between linear and nonlinear functions.
PBS
What We Do Adds Up
With so many tons of trash going into landfills each year, your environmentalists can calculate how much the average person is tossing away. This activity has a series of questions not only requiring math, but a conscious thought of how...
Curated OER
Affine Recurrence Plotter
Learners use the on-line affine recurrence plotter to graph equations. They work on-line to create graphs of trout in a trout pond and savings account balances when interest is compounded over time. Links to the four one-day lessons are...
Curated OER
Lesson #20 Rates of Change and Velocity
Students investigate speed. In this rate of change lesson, students complete a rate/time/distance table to determine the average m.p.h. of a given trip. They listen and follow along with the lecture and examples to determine the average...
Mathalicious
XBOX Xpotential
Touchdown! This is an exponentially insightful lesson that explores the growth of football games with different video game consoles. Class members discuss whether the increase of mergahertz can be described as linear or exponential. The...
Curated OER
Peanut Butter Broccoli - Creating New Produce Through Genetic Selection
Fifth graders understand that traits are inherited and change over time. In this physical traits lesson, 5th graders compare produce items for similar traits. Students create large graphs to show their results. Students discuss genetic...
Curated OER
Let's Make a Compost Cake
Students create a compost cake. In this gardening and decomposition science lesson, students review and describe the "nutrient cycle." Students create a compost pile, measure and record the dimensions and temperature of the pile, and...
Creative Learning Exchange
The Infection Game: The Shape of Change
Encourage the spread of knowledge in your class with this cross-curricular epidemic simulation. Pulling together science, social studies, and math, this lesson engages students in modeling the spread of infectious diseases, collecting...
Curated OER
Sunrise, Sunset
What locations on Earth get the longest number of hours of daylight in the summer? Hint: It's not the equator! Use real-world sunrise and sunset data to develop trigonometric models that can be used to estimate the number of hours of...
Rainforest Alliance
Investments in Forest Carbon
One hundred metric tons of CO2 can accumulate in one acre of forest over time—that's a lot of carbon! In the activity, groups of middle school learners determine what makes forests important. They then solidify the concept by using a...
Bowland
In the Olympics, are Women Improving Faster than Men?
Will the time come when women outperform men at the Olympic Games?Scholars investigate gender differences in Olympic Games performances. They study the historical participation of women and then analyze data to determine if women will...
Balanced Assessment
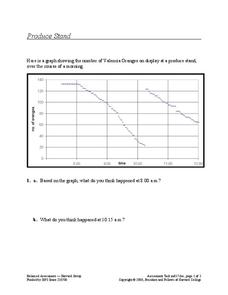
Produce Stand
Interpret a graph of the number of oranges at a produce stand to determine a likely event at different times. They also analyze the graph to determine which time period oranges were selling most quickly.
101 Questions
Slow Church
The church that just can't stay put! A video presentation raises questions of just how far the church will move. Presented with the rate of movement and a range of time expected, scholars build an inequality to answer the question.
Curated OER
Math in Science-Radioactive Decay and Half-Life
In this radioactive decay and half-life worksheet, students use given half-lifes to calculate the amount of time it will take for certain amounts of elements to decay. They also find the age of samples and determine how many grams of...
Curated OER
Modeling the Keeling Curve with Excel
In this modeling the Keeling Curve worksheet, students use given data beginning in 1960 to create a mathematical model for the changes in atmospheric carbon dioxide over time. Students manipulate the equation to predict the carbon...
Curated OER
What's Your Speed?
Learners explore the concept of distance v. time. They use a CBR to collect data on their distance over time, then plot their data using a scatter plot and find an equation to model their data. Pupils discuss what if scenarios which...
Mathalicious
Pic Me!
Finally! Math and Instagram have come together to discuss the correlation between likes and followers. High schoolers can't help but want to discover what makes one account more popular than another by developing a line of best fit and...
Curated OER
Worksheet 19: Ship Positions
In this math worksheet, learners read informational paragraphs and then answer 18 questions using data from their readings. Questions are about vectors, positions, distance and orbits.
Curated OER
Math Investigations Facilitation Plan
In this math lesson plan, students choose a topic involving math that interests them to investigate or research. Students make a plan detailing how they will investigate their topic; such as, keeping track of plant heights over time,...


