Curated OER
Galileo's Battle for the Heavens
Students view a video about Galileo's discoveries. They work together to create graphs showing the current sunspot cycle. They discuss how sunspots can cause communication devices problems.
Curated OER
How Fast Is Your Car?
Eighth graders discover the relationship between speed, distance, and time. They calculate speed and represent their data graphically. They, in groups, design a ramp for their matchbox car. The goal is to see who's ramp produces the...
Curated OER
Suffrage Strategies: Voices for Votes
Students discuss the history and importance of voting. In this voting instructional activity, students research the women's suffrage movement and the methods used to change people's beliefs about suffrage for women. Students also create...
Curated OER
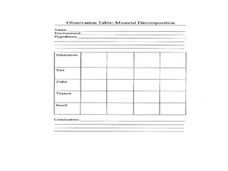
Slow Rot or Not?
Fifth graders examine how environmental factors affect decomposition. For this decomposition lesson, 5th graders experiment with the decomposition of grapes in five different environmental settings. They look at images of items that have...
Curated OER
Fishy Frequencies
Tenth graders demonstrate that natural selection is an agent of evolution. They quantitatively apply the Hardy-Weinberg Principle to an imaginary population of fish. They utilize math and graphing skills, collecting and analyzing data,...
Curated OER
Plant Growth
Third graders keep a journal and record the growth of their plant everyday over a two week period. With an observation written down for everyday of the week, they draw a picture of their plant in their journal on Monday and Friday...
Curated OER
The Best Friend of Charleston, The Charleston Railroad
Third graders explore the Charleston Railroad. In this South Carolina history lesson, 3rd graders examine the impact of the rail line on economy and citizens of the state. Students create posters to advertising the railroad line that...
Curated OER
Measuring Biodiversity
Learners collect species data from a mock intertidal community. In this biology lesson, students graph their data and analyze the species in it. They construct a species accumulation curve and present it to class.
Curated OER
The Breathtaking Nature of the Urban Explosion, Part 2
Learners explore ozone levels. They measure the concentrations of ground-level ozone in the atmosphere. Students observe changes in the concentrations of ozone over time. Learners complete a data sheet to record ozone readings over a...
Curated OER
Using an Amortization Table
Students search the Internet to find a site that contains an amortization table and make a hypothesis about the results of changing time and rate. They examine the affects of time and rate on a mortgage and discuss the difference in the...
West Contra Costa Unified School District
Sneaking Up on Slope
Pupils determine the pattern in collinear points in order to determine the next point in a sequence. Using the definition of slope, they practice using the slope formula, and finish the activity with three different ways to determine the...
Virginia Department of Education
Functions 2
Demonstrate linear and quadratic functions through contextual modeling. Young mathematicians explore both types of functions by analyzing their key features. They then relate these key features to the contextual relationship the function...
Population Connection
A Demographically Divided World
Did you know that birth and life rates vary across the world? The resource, the second in a six-part series, discusses just how demographics differ across countries and why it might be the case. Scholars complete worksheets, watch...
Curated OER
Random Probability
In this statistics and probability worksheet, young statisticians solve and complete 13 different problems related to probability, percentages, and normal distributions. They consider data models, assumptions about the models, and find...
Curated OER
Greenhouse Gases
Although the worksheet for the lab activity is not included, this is an activating activity for your class to do when learning about the greenhouse effect. They lay three thermometers underneath a lamp: one out in the open, one under a...
Curated OER
Temperature Stories
Students create a story that matches the provided temperature data. They use graphed temperatures as the plot for their creative writing story.
Curated OER
Green Leaves
Third graders, after having conducted one experiment three times, record their observations results in a chart. They predict what hidden colors they believe that a leaf holds. Students record their predictions in their science note books...
Curated OER
Distributive Property
Students solve problems using distribution. In this algebra lesson plan, students factor equations using the distributive property. They graph their solution on a graph.
Curated OER
Straight Line Motion in Two Parts
Students describe and quantify the motion of toy cars. In this motion activity, students observe a battery powered toy car on a flat surface and a standard toy car on a sloped surface. They write their observations, measure average...
Curated OER
Word Problems: "Leaving D.C."
In this solving math story problems worksheet, students read statistics from the Student edition of USA Today to solve word problems. Students solve 6 problems.
Curated OER
Asymptotes and Zeros
Learn how to explore rational functions and investigate the graphs rational functions and identify its singularities and asymptotes. High schoolers approximate the solutions to rational equations and inequalities by graphing.
Curated OER
Observing Weather
Students investigate the weather by reading children stories. In this weather observation lesson, students read Cloudy With a Chance of Meatballs and several other stories about weather before they create a KWL chart. Students utilize...
Curated OER
Lego Robotics: Measuring Speed
Students build and program a LEGO robotic car as well as measure and graph its speed. They acquire familiarity with principles of construction, motion, design and problem solving. They compare a robot's speed over two different surfaces...
Curated OER
Measuring Transpiration
In this transpiration worksheet, students will conduct an experiment to measure the rate of transpiration from a plant by measuring how much weight the plant loses over 5 days. Students will record their data and create a graph of the...


