Balanced Assessment
Ford and Ferrari
Which is faster, a Ford or a Ferrari? The short assessment has pupils analyze graphs to determine the rates of change between the two. Individuals interpret the rates of change within the context of speeds of the cars and develop a map...
EngageNY
Solution Sets to Simultaneous Equations (part 1)
How are systems related? Build on your pupils' previous knowledge of solving systems of equations by introducing systems of inequalities. Learners explore similarities between systems of equations and inequalities to make a strong...
American Physiological Society
Feeling the Heat
How do the changing seasons affect the homes where we live? This question is at the forefront of engineering and design projects. Challenge your physical science class to step into the role of an architect to build a model home capable...
101 Questions
Slow Church
The church that just can't stay put! A video presentation raises questions of just how far the church will move. Presented with the rate of movement and a range of time expected, scholars build an inequality to answer the question.
Curated OER
Every Graph Tells A Story
Seventh graders explore linear equations. In this graphing lesson plan, 7th graders explore constant rates of change. Students discover the real-life application of graphs and demonstrate their ability to read graphs and write...
Curated OER
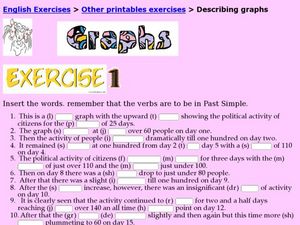
Describing Graphs
For this graphs worksheet, students fill in the blanks to sentences to describe graphs. Students complete 19 sentences total on this worksheet.
Curated OER
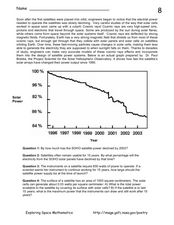
Cosmic Rays and Solar Cells
In this cosmic rays and solar cells worksheet, students read about how cosmic rays damage the electrical output of solar cells over time on satellites. Students use a graph of the solar power output compared to the year for the SOHO...
Curated OER
Repopulating Michigan's Waterways
Eleventh graders identify the parts of an ecosystem and how communities change over time. For this ecology lesson students formulate a habitat restoration plan.
Curated OER
Ice Cream Lab
I scream, you scream, we all scream for ice cream! Even high schoolers enjoy making ice cream. This laboratory exercise has them record the temperature changes throughout the process of liquid becoming solid, graph the results, and...
Curated OER
A Sweet Drink
Students investigate reaction rates. In this seventh or eighth grade mathematics lesson, students collect, record, and analyze data regarding how the temperature of water affects the dissolving time of a sugar cube. Studetns determin...
Curated OER
The Hudson's Ups and Downs
Even rivers have tides. Older elementary schoolers will discuss the Hudson River and how weather, water craft, and the ocean cause tidal fluctuation. They will examine a series of line graphs that depict tidal fluctuation, then analyze...
Curated OER
Canadian Social Trends
Students use surveys to explore how to design graphs, tables, and diagrams. They discuss articles which can stimulate ideas for research topics, or surveys of their own.
Curated OER
Is Portland, Oregon Experiencing Global Warming?
Students use data to determine if the climate in Portland has changed over the years. In this weather lesson students complete line graphs and study long wave radiation.
Curated OER
Mathematics in Bioengineering: Its Application for Today's Students
High schoolers explore the different fields of bioengineering. They will create and interpret graphs from cancel cells data. They then calculate the amount of drugs found in blood and eliminated by the body over time.
NASA
Climate Change Inquiry Lab
With global temperatures on the rise faster than ever recorded, the effects of a heating planet could be devastating. Allow learners to discover just what the world is in store for if the warming continues through a series of videos, a...
Curated OER
Mapping the Past
Students study historical maps to view how the world evolved from medieval times through the Renaissance. They work in groups to examine the maps and present a report on one of the listed maps.
Curated OER
After the Garbage Can: Where Does Our Trash Go?
Students explore how waste disposal has changed over time and what the current issues are. In this disposal lesson students collect data and create graphs.
Curated OER
Graphing Changes in Weather
Students graph current temperature and weather conditions for three days. In this weather lesson, students go to the Weather Channel's website and look up weather for their zip code then graph the conditions and record the current...
Curated OER
Have You Looked Outside? Lesson #5- Graphing Weather Conditions
First graders study daily weather changes. In this weather and graphing lesson, 1st graders chart the daily weather for a month using stickers or weather symbols. They graph the weekly weather so that at the end of the month students...
Rainforest Alliance
Forests of Guatemala
With 90 percent of its land area covered in forests, Suriname, a country in South America, contains the largest percentage of forests throughout the world. Here is an activity that brings classmates together to learn about the...
Balanced Assessment
Para-Ball-A
Analyze the flight of a thrown ball. Learners determine the maximum height of a thrown ball and the time it takes to hit the ground given its initial speed. They continue to review different scenarios with different maximums or different...
CK-12 Foundation
Butterfly Stroke
Swimmers improve their times by understanding the physics of their sport. As a swimmer moves through the water, the efficiency of motion affects the resulting velocity. Through an interactive simulation, pupils change the level of motion...
Curated OER
Nutria And The Disappearing Marsh
Young analysts examine changes in the nutria population, vegetation density, and marsh area over time in the wetlands of Louisiana. They import data and use the TI-73 Explorer to graph and analyze the effects of nutria on marsh loss.
Curated OER
Constitution/Impeachment/Reconstruction
Eleventh graders analyze a chart comparing U.S. census data from 1850, 1880, 1900, and 1920. They read a handout summarizing immigration legislation from 1882-1996 and create a graph charting how open / closed U.S. immigration is over time.


