Curated OER
Multiplication Chart
In this math worksheet, students analyze four multiplication charts. Each chart is illustrated with a different cartoon character.
Curated OER
Problem-Solving Decisions: Choose the Operation: Problem Solving
In this math operations worksheet, students solve the word problem using the pie chart and following the steps of understand, plan, solve, and look back. Students then answer a final question by choosing the operation and solving.
Curated OER
Make a Tally
In this tally chart activity, learners read the word problems and use the information within the problem to make a tally chart. Students use the tally charts to help them finish and solve the word problem.
Curated OER
Five Minute Adding Frenzy (B)
In this addition worksheet, students complete a five minute addition frenzy sheet. They complete 4 charts finding the sums of the columns and rows in each space. They have five minutes to finish each chart with 98% accuracy.
Curated OER
Research: pop artists
In this research activity, students research which pop artist has spent the most time on the top of the charts and list how many weeks they spent there. Students research 20 pop artists.
Curated OER
Data Analysis
In these analyzing data worksheets, learners complete a table and a pie chart and calculate mean, median, mode, and range for sets of data.
Curated OER
My Science Box
Students investigate snails and their physical and behavioral characteristics. In this investigative lesson students create a pie chart to show the results of their findings.
Curated OER
A Collage of American Icons: Presidents and Symbols
Students use KWL charts, stores, news, books, and movies to learn about the Presidents and symbols of America. In this Presidents and symbols lesson plan, students participate in many activities that introduce them to the leaders and...
Curated OER
Fruits and Vegetables
In this fruits and vegetables worksheet, students use charts about food choices to solve problems, use logical thinking to complete a chart and find food names in a word scramble.
Curated OER
The Meaning of Whole Numbers
In this whole numbers worksheet, students fill in different charts asking about the place value of various whole numbers. Students complete 8 problems.
Curated OER
Subtracting Integers
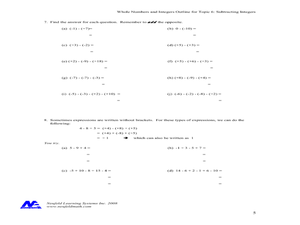
In this subtracting integers worksheet, students complete problems and fill in charts that require them to subtract integers. Students complete 8 problems.
Curated OER
Percent of a Number
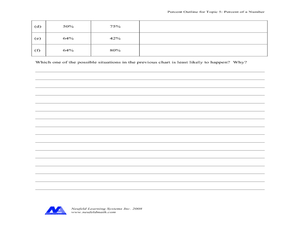
In this percent worksheet, students complete problems such as changing percents to decimals, filling in percentage charts, and more. Students complete 8 problems.
Curated OER
Fill in the Graphs
In this graphing information activity worksheet, students use the 6 provided clues to appropriately fill in the blanks in a pie chart.
Curated OER
High Tech Food
Learners view videos, read, and fill in charts about agriculture production. For this agriculture lesson plan, students complete these agriculture activities and explore careers in agriculture.
Curated OER
Chart Reading - Uninsured in the United States of America
In this chart reading instructional activity, students click on the links to read different charts about health insurance in the United States and then answer short answer questions about it. Students complete 7 questions total.
Curated OER
Advertising and Consumerism of the 1920's
Eleventh graders discover the impact of advertising in 1920's America. In this 20th century history instructional activity, 11th graders complete KNU charts as they research marketing techniques that were used during the decade to...
Curated OER
Charting African Ethnicities in America
Students explain the variety in ethnic origins of enslaved Africans brought to the United States. They use the data in the narrative to create charts, either by hand or by using Excel or a similar database program.
Math Worksheets Land
Pie or Circle Graphs - Matching Worksheet
It's one thing to be able to read a pie graph, but it's another to analyze a pie graph and match it to its data table. Use a multiple choice learning exercise when challenging learners to practice this skill. With six data charts and pie...
Curated OER
Learning About Location: Charting the Path of the George W. Elder
Students acquire a working knowledge of the geographical concepts: absolute location, relative location, longitude and latitude. They analyze primary sources that shows the physical and human characteristics of the places along the 1899...
San José State University
Organizational Patterns for the Comparison/Contrast Essay
Organization is key in essay writing. The two organizational charts included in this resource model the block approach and the point-by-point approach to organizing a compare and contrast style essay. After examining the charts, writers...
Curated OER
Energy Balance Tracker
Use this graphic organizer to record what food and drink is consumed in one day. Also record all activity performed on this same day. The class will need some charts regarding the calories in food items. Also needed are charts regarding...
New York City Department of Education
Grade 5 Literacy: TCRWP Nonfiction Reading and Opinion/Argument Writing
Choose a side! Pupils watch and read several nonfiction resources about zoos. After gathering their research, they choose a side either for or against closing zoos. Scholars complete KWL charts, anticipation guides, flow charts, and...
EngageNY
Adding to Cascading Consequences and Stakeholders: Industrial Organic Food Chain
Researchers continue determining the effects of the industrial organic food chain that Michael Pollan describes in The Omnivore's Dilemma. In teams, pupils add to their Cascading Consequences charts and complete Stakeholders charts based...
EngageNY
Determining Cascading Consequences Using The Omnivore’s Dilemma: Hunter-Gatherer Food Chain
Focusing on the consequences of the hunter-gatherer food chain that Michael Pollan discusses in The Omnivore's Dilemma, teams work together to create hunter-gatherer food chain consequences charts. Next, scholars view other groups'...
Other popular searches
- Charts and Graphs
- Multiplication Charts
- Maps and Charts
- Tally Charts
- Pie Charts and Graphs
- Pie Chart
- Multiplication Charts to 100
- Reading Charts and Graphs
- Behavior Charts and Graphs
- Charts and Graphs Candy
- Interpret Charts and Graphs
- Charts and Graphs Christmas


