Curated OER
Chapter 24: Pure Monopoly
Monopoly is more than a game in this presentation, which explores the characteristics of four different market models. Representing the concept of a monopolistic economy in both charts and graphs, the information in these slides can be...
Curated OER
Chapter 23: Pure Competition
Taking your young economists through the characteristics of four market models (Pure Competition, Pure Monopoly, Oligopoly, and Monopolistic Competition), this presentation uses both charts and graphs to illustrate the necessary...
Curated OER
Chapter 17: Economic Growth and the New Economy
Is economic growth necessary to remain a relevant world power? These slides discuss the definition and implications of growth economics, complete with global comparisons and ways to account for growth. Graphs and charts are easy to read...
Curated OER
Human Genetic Diseases
Although there are a few missing titles in this collection of slides, if your class has the support of a genetic disease lecture to accompany it, this resource will be very useful. The mechanism of genetic inheritance is covered. Flow...
Curated OER
Human Genetic Diseases
Although there are a few missing titles in this collection of slides, if your class has prior knowledge of genetic diseases then this resource could be useful. The mechanism of genetic inheritance are covered and both flow charts and...
Curated OER
Unit 3 Bonding
An organized table charting the different types of chemical bonds arrays this resource. The octet rule, ionization energy, and the naming of compounds are also reviewed. Young chemists answer review questions in multiple choice fashion....
Curated OER
Parliament Limits English Monarchy: Ch 21
This teaching tool allows you to check-up on your students' understanding and use their notes to fill out charts on British rulers who have relations with Parliament. The first 6 slides have the name of 1 ruler and an area to type what...
Curated OER
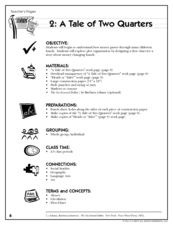
A Tale of Two Quarters
Have your class use the life of a quarter to understand and design plot and flow charts. They read the book, The Go-Around Dollar, think about how their teacher got her quarters that day, then create a flow chart. They have to show how...
Curated OER
Density
This sequence of slides is a fabulous introduction to the concept of density as it relates to mass, volume, physical impact, and interpretation. Various examples are given and your class will find the charts and procedures helpful in...
Curated OER
Electricity
Each of these slides presents the basic scientific details and situations where charge, or static may appear. Handouts of the empty PowerPoint slides could be provided so that students could work through these examples and correctly...
Curated OER
Atoms, Molecules and Ions
Atomic theory, experiments that contributed to our knowledge of matter, atomic structure, isotopes, and ions are covered in these 33 slides. Quality diagrams and labeled charts will help activate understanding. The presentation concludes...
Curated OER
Circulatory System
The ciculatory system is introduced here by means of clear, labelled diagrams and charts with details. After learning the basics of the heart strucure, a sequence of slides help show the flow the blood as the heart muscle contracts. A...
Curated OER
Pollination and Fertilization
Save yourself time by using this concise arrangement of slides about pollination and fertilization in plants. Minimal wording is included, but the graphics are educational. You will also find charts for the adaptations of both...
Curated OER
The Gene Scene
Sixth-grade scientists gain understanding of how genetic traits manifest with simple experiments, such as determining whether their tongues are roller or non-roller, taster or non-taster. Extensions include performing tests at home with...
Curated OER
Prose Styles: Tough, Sweet, and Stuffy
Take a walk on the rhetorical side with this presentation, which discusses three styles of prose: tough (ethos), sweet (pathos), and stuffy (logos). The slide show provides thorough definitions and examples of each style, as well as...
Curated OER
Connecting Letters and Memory
Elementary students with mild to moderate mental disabilities use a variety of tools to connect letter sounds to images. They use flash cards, posters, and writing while saying to connect letter image to phonemic equivalent. Then, they...
Curated OER
Suffixes That Sound Like "Shun"
The suffix, -tion is used with great frequency in our language. This presentation challenges learners to fill in charts with words that use this suffix. They must think of words that end in -cian, -sion, -ssion, -tion, and even words...
Curated OER
Counting on a 100 Square
Counting by twos, fives, and tens is a great way to build the skills and number sense needed to better grasp the concept of multiplication later on. Here are six number charts to 100, each chart is highlighted and requires the class to...
Curated OER
Mrs. Lewis's Pets: Tally Mark Activity
To cute to pass up! This slide show activity has learners count the number of pets Mrs. Lewis has using tally marks. As the show progresses, kids pay attention and make a tally for each type of pet they see. Suggested uses and audio are...
Curated OER
Reading Bar Charts
Help kids understand how to collect data through surveys, organize data in a bar chart, then analyze their findings. There are three different surveys for learners to conduct, a full description of all the parts of a bar chart, and three...
Curated OER
Focus on Economic Data: US Real GDP Growth, August 26, 2011
Young economists answer a series of critical thinking questions as they analyze real data that shows GDP Growth. They examine the provided charts, read through the background information, and discuss changes that occurred in the third...
Media Smarts
TV Dads: Immature and Irresponsible?
Examine gender stereotypes on television, focusing on fathers portrayed in sitcoms and advertising. Questions on a handout direct learners to consider the types of fathers they see on television and one advertisement is highlighted as...
Curated OER
Where We Live
Who has the most? Young learners practice charting data using familiar information. They help fill out a classroom chart by recording the number of people, pets, televisions, etc. in their home. Guiding questions help them investigate...
Curated OER
Gustar and Similar Verbs
The -ar verbs gustar and encantar are often confusing to non-native speakers, so give your beginning classes this reference guide to help them understand the shift in sentence formation. The well-organized charts are effective and clear,...
Other popular searches
- Charts and Graphs
- Multiplication Charts
- Maps and Charts
- Tally Charts
- Pie Charts and Graphs
- Pie Chart
- Multiplication Charts to 100
- Reading Charts and Graphs
- Behavior Charts and Graphs
- Charts and Graphs Candy
- Interpret Charts and Graphs
- Charts and Graphs Christmas


