K12 Reader
Making Predictions
Read efficiently and effectively with a passage about making predictions and using headlines and visual aids as clues. After kids read a few paragraphs in the passage, they answer five comprehension questions on the side of the page.
Curated OER
Express Yourself Lesson Seed 12: Story Event
Focus on plot and the impact-specific events in The Cay. Class members use their double-entry journals, created in a previous lesson in this series, to record their thinking about the guiding question as they read chapters 15 through 17....
Mr. Hill's Science Website
Solar System Fact Sheet
Here is a fantastic, educational handout packed with information and facts not only about the planets in our solar system, but also regarding major moons and their surface features, dwarf planets, comets, and asteroids.
Federal Reserve Bank
Measuring the Great Depression
Young historians examine the cost of goods and services through the Consumer Price Index (CPI), output measured by Gross Domestic Product (GDP), and unemployment measured by the unemployment rate to gain an understanding of the economic...
K-5 Math Teaching Resources
One Hundred Chart Template
There are hundreds of learning opportunities with this hundreds chart. Just print, laminate, and you're ready to get counting.
Santa Ana Unified School District
Getting to the Core: Globalization
How have advances in technology and communication changed our world? That is the questions that world history students contemplate as they examine a series of primary and secondary source materials
Center for Learning in Action
Density
Explore the concept of density within states of matter—gases, liquids, and solids—through a group experiment in which young scientists test objects' texture, color, weight, size, and ability to sink or float.
Math Learning Center
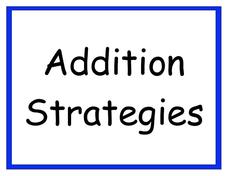
Addition Strategies
Help young mathematicians refer to simple addition strategies with a set of math posters. The pages feature ways to remember how to add zero to a number, how to determine if a number is odd or even, and making fast tens.
CPO Science
Science Worksheets
If you need an array of worksheets to augment your science lessons, peruse a collection of assignments that is sure to fit your needs. With topics such as metric conversion, the scientific method, textbook features, research skills,...
MENSA Education & Research Foundation
Probably Probability
Reinforce the concept of probability with a series of lessons highlighting the idea of likelihood, probability formulas, relative frequency, outcomes, and event predictions. The collection is made up of four lessons offering informative...
EngageNY
Revisiting Bud’s Rules: Survive or Thrive?
Bud followed a series of rules from Bud, Not Buddy by Christopher Paul Curtis. The question is, how did he use those rules to thrive or survive? After a grand discussion, class members explore the novel to locate and cite textual...
Illinois Valley Community College
STEM Activities for Middle School Students
Use STEM activities within the class to provide connections to concepts. The resource includes activities that range from working with buoyancy to building rockets and launching them. Other activities involve the engineering design...
Open Text Book Store
Arithmetic for College Students: Worksheets
Loaded with concepts ranging from multiplying decimals to converting units to solving problems using the order of operations, a thorough practice packet is perfect for a fifth or sixth grade math classroom.
Do2Learn
T-Chart (Topics of Conversation)
A T-chart matrix provides learners with a way to record the different responses to a conversation.
Do2Learn
Topic Tree
Here's a graphic that provides learners a place to record their ideas on any topic. After identifying a subject, they record their ideas within the follage of the tree.
Virginia Department of Education
Graphs
Examine different types of graphs as a means for analyzing data. Math scholars identify the type of graph from a series of data displays and then develop questions to match each one. Then, given a scatter plot of height versus age data,...
Pace University
Grade 7 Earth Day Statistics with Circle and Bar Graphs
Take a tiered approach to studying waste. The lesson uses Earth Day to present differentiated instruction around using circle and bar graphs. Each group gets a cube based on their tiers and works collaboratively as well as individually...
Newspaper Association of America
By the Numbers: Mathematical Connections in Newspapers for Middle-Grade Students
A cross-curricular resource teaches and reinforces mathematical concepts with several activities that use parts of a newspaper. Scholars use scavenger hunts to find the different ways math is used in the paper along with using data...
Anti-Defamation League
Women’s Inequity in Pay: Could It Be Sexism, Implicit Bias or Both?
Equal pay for equal work? High schoolers research the reasons for the inequity in women's pay. They read articles, examine graphs, engage in discussion, and then craft an essay in which they suggest a way to address the gender wage gap.
Curated OER
My Test Book: Reading Graphs
In this online interactive math skills worksheet, students solve 10 multiple choice math problems that require them to read and interpret graphs. Students may view the correct answers.
Curated OER
Shifts in Supply and Demand
Providing four supply and demand charts for your students' interpretation, Part A of this activity quizzes their comprehension skills with six questions below. In Part B, students analyze additional charts and choose whether or not the...
Curated OER
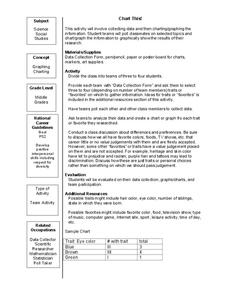
Chart This!
Students collect data and graph or chart the information. In this data organization lesson, students poll their classmates about certain topics and chart or graph the information to show the results of their research.
Curated OER
Relative Dating-Telling Time Using Fossils
Students explore how to read fossil range charts. They develop an knowledge of the strengths and weaknesses of the fossil record. Students become familiar with the concepts index fossil and fossil range. Students use bar graphs to...
Curated OER
Effect of pH on the Organisms of Tule Ponds At Tyson Lagoon
In this aquatic organism learning exercise, students measure the pH of household solutions and of pond water samples. They compare these to tolerance charts for aquatic macro-invertebrates to complete 5 charts or short answer questions.
Other popular searches
- Charts and Graphs
- Multiplication Charts
- Maps and Charts
- Tally Charts
- Pie Charts and Graphs
- Pie Chart
- Multiplication Charts to 100
- Reading Charts and Graphs
- Behavior Charts and Graphs
- Charts and Graphs Candy
- Interpret Charts and Graphs
- Charts and Graphs Christmas


