Curated OER
Mathematics Module
Delve into graphing! The concepts covered begin with basic graphing basic coordinates and algebraic expressions on coordinate planes, and build up to graphing linear inequalities and equations. Learners solve and simplify various...
Curated OER
Pumpkin Play
Have you ever examined a pumpkin and estimated the number of lines it has? In this math lesson, students count the actual number of lines, record and graph the results. They investigate the circumference, weight and buoyancy of the...
Curated OER
M&Ms Count and Crunch
Middle schoolers practice skills involving statistics and probability by making predictions on number of each color candy in one pound bag of M&Ms. They record both guesses and actual quantities, calculate percentages, and create bar...
Curated OER
Color Burst
Fourth graders explore how colors react in water (chromatography) and other solvents. They observe, investigate, measure, record data and communicate their results in the form of graphs/charts and narration presented to the class....
Curated OER
A Research Project and Article For the Natural Inquirer
Get your class to use the scientific process to solve a scientific problem. They utilize the Natural Inquirer magazine to identify a research question which they write an introduction to and collect data to answer. They use graphs,...
Curated OER
Yummy Math
Young mathematicians use bags of Skittles to help them gain practice in graphing and organizing data. They work in pairs, and after they have counted and organized their Skittles, they access a computer program which allows them to print...
ARKive
Handling Data: African Animal Maths
Handling and processing data is a big part of what real scientists do. Provide a way for your learners to explore graphs and data related to the animals that live on the African savannah. They begin their analysis by discussing what they...
Curated OER
James and the Giant Peach Plot Analysis
It's all about the plot, main events, and story mapping with this lesson. As the class reads the novel James and the Giant Peach, they create an excitement graph that actually charts key events and moments of excitement. After creating...
Curated OER
Pizza! Pizza!
Third graders tally, sort, and organize pizza orders from monthly school sales. They create an advertising campaign to promote the School Pizza Sale, record the data in graph form, compare and contrast the tallies throughout the year,...
Sharp School
Geography Project
This very simple geography project can lead to a lot of useful referential information that can be displayed in your classroom! Learners construct a poster-size map of a country, identifying major demographic points and including pie/bar...
Curated OER
Waves
Light waves and sound waves are the focus of this science lesson designed for 5th graders. Besides discovering how these waves travel, learners also discover the basic properties of waves, and analyze data tables and graphs. The...
Curated OER
How Does Your Blue Bonnet Grow?
Learners explore the conditions needed to grow Texas Blue Bonnets. In this Blue Bonnet planting lesson, students recognize the differences in Texas Blue Bonnet. Learners record their findings in a graphs and analyze their results.
Curated OER
Hot and Cold Colors
Students experiment with the color and solar energy absorption. In this color and solar energy absorption lesson plan, students spend two days discussing and experimenting with the concept of energy absorption. They paint cans with...
National Research Center for Career and Technical Education
Business Management and Administration: Compound Interest - A Millionaire's Best Friend
Many math concepts are covered through this resource: percentages, decimals, ratios, exponential functions, graphing, rounding, order of operations, estimation, and solving equations. Colorful worksheets and a link to a Google search for...
Curated OER
Understanding "The Stans"
Students explore and locate "The Stans" in Central Asia to create, write and illustrate maps, graphs and charts to organize geographic information. They analyze the historical and physical characteristics of Central Asia via graphic...
Curated OER
Visual Literacy: Using Images to Increase Comprehension
A colorful PowerPoint is a great way to introduce the topic of visual literacy. The eye-catching presentation begins with an overview of visual literacy and then provides some specific strategies to help enhance reading comprehension. As...
Curated OER
Trends of Snow Cover and Temperature in Alaska
Students gather historical snow cover and temperature data from the MY NASA DATA Web site. They compare this data to data gathered using ground measurements from the ALISON Web site for Shageluk Lake. They graph both sets of data and...
Curated OER
Exploration of "Pillbugs"
Fifth graders define vocabulary terms, identify the characteristics of a pillbug, and create a dichotomous key. Then they examine the pillbugs and make observations and record these observations. Finally, 5th graders observe specific...
Curated OER
It's Your Life - Safe or Sorry/Safety Issues
Young scholars examine and chart data about safety hazards and unsafe situations. In this safety hazard lesson, students examine newspapers and web sites to investigate injuries from safety hazards. They make a spreadsheet using the data...
National Museum of Nuclear Science & History
Alphas, Betas and Gammas Oh, My!
Referring to the periodic table of elements, nuclear physics learners determine the resulting elements of alpha and beta decay. Answers are given in atomic notation, showing the atomic symbol, mass, atomic number, and emission particles....
Federal Reserve Bank
The Output Gap: A‘Potentially’ Unreliable Measure of Economic Health?
How can we accurately estimate what the economy should produce now and in the future? Have your pupils tackle this question as they learn about real versus potential GDP and as they review data regarding the output gap in the United States.
Curated OER
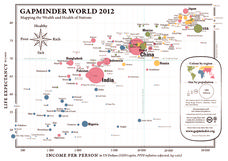
Gapminder World 2012
Here is a very interesting infographic that compares the average life expectancies, per capita incomes, and population sizes of every country in the world in 2012.
Curated OER
Perceived Risks
Learners rank a list of everyday risks to compare with classmates. They rate each risk on both its ability to be controlled and its observability in the environment. Results are graphed.
Curated OER
Ancient Greece and Ancient Rome Unit Plan
Students make two T charts, one for Sparta and one for Athens, showing pros and cons for living in either city-state. They use the physical information from the map and the cultural captions given for Athens and Sparts to come to their...
Other popular searches
- Pie Charts and Graphs
- Reading Charts and Graphs
- Behavior Charts and Graphs
- Charts and Graphs Candy
- Interpret Charts and Graphs
- Charts and Graphs Christmas
- Charts and Graphs Math
- Analyzing Charts and Graphs
- Tables, Charts and Graphs
- Charts and Graphs Europe
- Using Charts and Graphs
- Bar Graphs and Charts


