Curated OER
Mapping Possible Solutions
Fourth graders propose possible sites for the heart of Florida state capital by mapping collected data onto a Florida state map and recording data in a Travel Log.
Curated OER
Using Charts and Graphs to Study East Asia's Modern Economy
Students examine East Asia's modern economy. In groups, classmates use the internet to compare the resources, products, and economy of specified countries. After collecting the data, pupils create charts, tables and graphs. They...
Curated OER
Mapping the Ocean Floor
Young scholars study the bottom structure of underwater habitats and how they can be mapped.
Curated OER
Geography: Mapping Newspaper Coverage
Students examine the locations of stories appearing in newspapers and determine where to assign reporters. Using various maps, they connect the stories to the correct maps and create charts of the story locations. Students explain their...
Curated OER
Did You Feel That? Earthquake Data Chart
Students plot earthquakes on the world map using coordinates of longitude and latitude. They designate the earthquakes magnitude with a symbol which they include in the map key.
Curated OER
THE GULF STREAM
Students explore how to describe the Gulf Stream, how Benjamin Franklin charted it, and correctly plot it on a map.
Curated OER
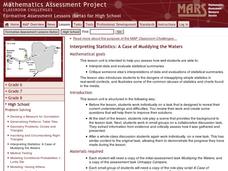
Interpreting Statistics: A Case of Muddying the Waters
Is river pollution affecting the number of visitors to Riverside Center, and is the factory built upstream the cause of the pollution? Let your class be the judge, literally, as they weigh the statistical evidence offered by the factory...
Curated OER
Creating a Character Chart for the Secret Garden
The Secret Garden, is a wonderful book to read with your class. After reading, why not employ the lesson plan presented here as a follow up activity? In it, pupils create character charts that portray the tremendous changes that...
Columbus City Schools
What is Up Th-air? — Atmosphere
Air, air, everywhere, but what's in it, and what makes Earth's air so unique and special? Journey through the layers above us to uncover our atmosphere's composition and how it works to make life possible below. Pupils conduct...
Curated OER
How Far Did They Go?
Students create a map. In this direction and distance lesson, students come up with familiar places in the community and calculate the distances from these places to the school. Students create a map that displays these places and their...
Curated OER
The Desert Alphabet Book
Students explore world geography by researching a science book with their classmates. In this desert identification lesson, students utilize a U.S. map to locate the geographical locations of deserts. Students create an oral report based...
Curated OER
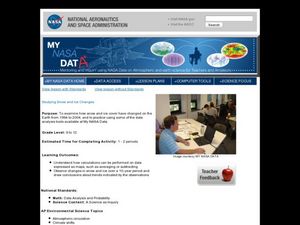
Studying Snow and Ice Changes
Students compare the change in snow and ice over a 10 year period. In this environmental science lesson, students use the live data on the NASA site to study and compare the monthly snow and ice amounts on a map of the entire...
Curated OER
Physical Geography- Climate
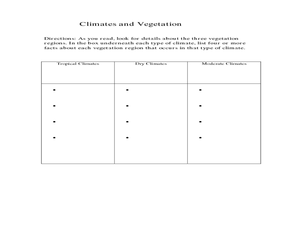
Sixth graders explore different climates. In this compare and contrast lesson, 6th graders look at the differences in climates of America and Europe. Students use KWL charts and graphic organizers to record information about different...
Curated OER
Mapping Your Community
Students define the boundaries of their community by comparing the community's official boundaries with other historical, political, physical, and perceived boundaries of the area and create a community map.
Curated OER
Tables, Charts and Graphs
Young scholars examine a science journal to develop an understanding of graphs in science. In this data analysis lesson, students read an article from the Natural Inquirer and discuss the meaning of the included graph. Young...
Curated OER
Lobster Business Charts
Students research four Maine based businesses involved with lobster fishery as a career analysis. In this career exploration lesson, students research lobster fishery businesses and write a class book showing the progression of a lobster...
Curated OER
A World of Information
Students analyze data and statistics about countries around the world. They read graphs and charts, color a world map to illustrate the top ten statistics about the world, and write a paragraph to summarize their information.
Curated OER
Where Has It Been? Tracking the Ivory-Billed Woodpecker
By studying the assumed extinction, and subsequent rediscovery of the Ivory-billed Woodpecker, learners use maps and come up with a scenario for the rediscovery of the bird. This incredibly thorough lesson plan is chock-full of...
Curated OER
Informational Text Features
How can you tell if the text you're reading is informational or narrative? Show your reading class this basic PowerPoint to illustrate the characteristics of an informational text. What makes this presentation especially effective is...
Curated OER
Arkansas is Our State: Differentiating Between a State and a Country
An ambitious geography lesson is geared toward kindergartners. They discover what the differences are between states and countries. They look at maps of Arkansas, and learn what the shapes and lines mean. Additionally, they create a...
Curated OER
World War I
Using maps, diagrams, and lists, this resource is a wonderful way to review the main concepts involving WWI. There are charts with a comparison of imperialism and nationalism, and other key ideas that explain how Europe plunged into this...
Curated OER
Air Pollution in Mexico City
A fantastic lesson on urban air pollution problems throughout the world is here for you. Learners understand that there are many factors involved in creating pollution, that there are many health effects brought on by air pollution, and...
National Park Service
News Bearly Fit to Print
There are an average of three human fatalities by bears in North America every year, which is low when you compare it to the 26 killed by dogs and the 90 killed by lightning annually. The lesson encourages researching human-bear...
Other popular searches
- Maps and Charts
- Analyze Maps and Charts
- Reading Maps and Charts
- Ireland Maps and Charts
- Tables, Maps and Charts
- Maps Graphs and Charts
- Maps, Charts, Globes
- Interpreting Charts and Maps
- Tables Maps and Charts
- Graphs, Charts and Maps
- Graphs\, Charts and Maps
- Word Maps and Charts


