Virginia Department of Education
May I Have Fries with That?
Not all pie graphs are about pies. The class conducts a survey on favorite fast food categories in a lesson on data representation. Pupils use the results to create a circle graph.
Curated OER
Review Graphing Parabolas & Circles
Young scholars review how to graph parabolas. They practice graphing two different parabolas using the vertex and table method. They solve problems related to graphing circles, determining the radius and the center.
Math Worksheets Land
Pie or Circle Graphs—Step-by-Step Lesson
How do you display data that you've collected in a pie chart? Follow a clear step-by-step guide to turning survey results into a visible format. It shows kids how to determine the percentage of the whole that each section represents.
Curated OER
Identifying Different Types of Graphs
This is an outstanding presentation on graphs and statistics. Learners choose which type of graph is being shown, and also gain practice in the techniques used to find the mean, median, and mode of sets of numbers. Very good!
Curated OER
Birthday Graph
Students explore graphs. In this graphing math lesson, students record the birthdays of each classmate on a data table. Students cut out and add a picture of a birthday cake to a floor or wall pictograph representing the month in which...
Curated OER
Circle Graphs
Sixth graders interpret, create, and display data in a circle graph. In this circle graph lesson plan, 6th graders use a compass, protractors, pizza boxes, and more to create a circle graph and analyze the data they put into it.
Curated OER
Creating Circle Graphs using Excel
Fifth graders evaluate data from a circle graph that compares time spent on various activities. They use the computer to manipulate their own data as they compare, examine, create and evaluate data using circle graphs.
Curated OER
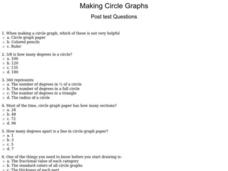
Making Circle Graphs
In this circle graphs instructional activity, students answer multiple choice questions about how to make circle graphs. Students answer 10 questions total.
Curated OER
The Circle Graph
In this circle graph worksheet, students complete problems involving many circle graphs including a compass rose, degrees, and more. Students complete 7 activities.
Curated OER
Circle Graphs
Sixth graders participate in a lesson that covers the reading and interpretation of a circle graph. They review the part of a whole concept for percents and student observe and practice using the circle graph.
Curated OER
Using Circle Graphs
In this circle graphs worksheet, students read a story about buying craft materials. Students examine the circle graph that shows how much spent on each type of material. Students then solve 3 problems using the data shown.
Curated OER
Problem-Solving Application: Use Circle Graphs
In this problem-solving worksheet, 5th graders problem-solve 2 mathematical equations involving 4 key steps and 2 circle graphs.
Curated OER
Problem-Solving Application: Use a Circle Graph
In this graphing worksheet, 4th graders use a circle graph with information about orchestra instrument to answer 5 questions. They examine the graph to find the information needed to problem solve each answer.
Curated OER
Class Trip: Circle Graphs
In this circle graph learning exercise, students fill in a graph showing given percentages about a class trip and explain why a circle graph would be used, then compete another circle graph with different given information.
Curated OER
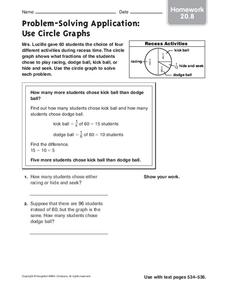
Problem-Solving Application: Use Circle Graphs
In this problem solving worksheet, students analyze the information in a circle graph about recess activities. Students use this graph to solve 2 application problems.
Curated OER
Circle Graph: Snoozing Animals
In this circle graphs worksheet, students make a circle graph for each animal shown in a chart showing average number of hours each animal sleeps and is awake.
Curated OER
Circle Graph
In this math worksheet, students analyze a circle graph. The circle graph can be used for a variety of math activities and divided into different fractions.
Curated OER
Shopping With a Circle Graph
In this shopping with a circle graph worksheet, students use the data in the graph to answer 8 questions about the money they have and how they can spend it.
Curated OER
Pizza Possibilities
Middle schoolers create and interpret line plots, bar graphs, and circle graphs. The lesson assumes mastery of conversions from fraction to decimal to percent, construction of angles, and at least an introduction to graphs displaying data.
Curated OER
Your Tax Dollars at Work
In order to understand how tax dollars are spent, young economists use given data and graph it on a circle graph. Circle graphs are highly visual and can help individuals describe data. A class discussion follows the initial activity.
CK-12 Foundation
Displaying Categorical Variables: Spending Habits
Bar or circle graph—which is best? Given a circle graph and a total amount of money earned, pupils calculate the amount of money in each category. Learners use the calculated amounts to create a bar graph and compare the two displays.
Curated OER
Play It
There are a number of activities here that look at representing data in different ways. One activity, has young data analysts conduct a class survey regarding a new radio station, summarize a data set, and use central tendencies to...
EngageNY
Graphing the Tangent Function
Help learners discover the unique characteristics of the tangent function. Working in teams, pupils create tables of values for different intervals of the tangent function. Through teamwork, they discover the periodicity, frequency, and...
Other popular searches
- Percent Circle Graph
- Circle Graph Worksheet
- Circle Graph Template
- Interpreting Circle Graphs
- Circle Graph Protractor
- Circle Graph Activity
- Reading Circle Graphs
- Circle Graphs Pie Charts
- Circle Graph Central Angle
- Bar and Circle Graphs
- Circle Graph in Excel
- Family Budget Circle Graph


