Curated OER
Clouds
Students explore basic cloud types and the weather associated with each one. In this earth science lesson, students participate in numerous activities including going outside to observe the clouds they see, making a cloud in a jar,...
Curated OER
Snack Attack
Students design charts, tables, graphs, and pictographs to analyse the types of snacks in a bag.
Curated OER
After the Garbage Can: Where Does Our Trash Go?
Learners explore how waste disposal has changed over time and what the current issues are. In this disposal instructional activity students collect data and create graphs.
Curated OER
A Recipe for Air
Learners create a pie graph using M&Ms to demonstrate the composition of air. They label each section of the graph, and list the fractions from largest to smallest.
Curated OER
Comparing Fractions 7
In this elementary math worksheet, 3rd graders compare circle graphs written as fraction models to determine the correct ratio value for the 2 questions.
Curated OER
My Test Book: Reading Pie Charts
In this math skills worksheet, students solve 9 multiple choice math problems that require them to read and interpret charts. Students may view the correct answers.
Curated OER
What Pie?
Students practice making and interpreting pie graphs so they are better able to decide if a pie chart is the appropriate form of display. Students examine included overheads of different pie charts, and directions on how to make pie...
Curated OER
Histograms and Statistical Graphics
In this statistics worksheet, students solve 6 data problems. They construct a histogram of given data, they create a frequency polygon, and a stem and leaf diagram. Students create a dot plot and a pie chart for given data sets. On the...
Curated OER
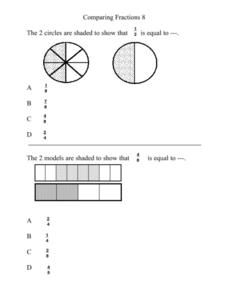
Comparing Fractions 8
In this elementary math worksheet, 5th graders compare fractions using a pie chart and practice finding the values in the multiple choice format.
Bowland
Alien Invasion
Win the war of the worlds! Scholars solve a variety of problems related to an alien invasion. They determine where spaceships have landed on a coordinate map, devise a plan to avoid the aliens, observe the aliens, and break a code to...
Curated OER
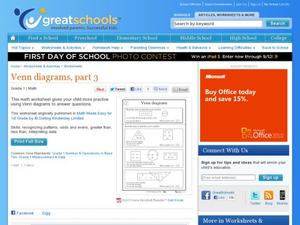
Venn Diagrams, Part 3
Can your first graders interpret Venn diagrams? Different sets of clues help pupils narrow down a specific number in different shapes. They determine odds and evens, greater than or less than, and what shape the number is in. A fun...
Balanced Assessment
Fit-Ness
Serve four towns with one bus route. Pupils develop a bus route that meets certain criteria to serve four towns. They determine which of the routes would best serve all of them. Individuals then hypothesize where a fifth town should be...
Concord Consortium
Line of Sight
There's no way around it—learners must use trigonometry to model the line of sight around a race track! Using the starting line as the origin, pupils model the straight line distance to any car using a trigonometric expression. The...
Curriculum Corner
7th Grade Math Common Core Checklist
With so many math standards to fit into a school year, it can be difficult keeping track of what you have and have not covered. This collection of Common Core checklists allows you to maintain a running record of when each standard was...
Curriculum Corner
7th Grade Math "I Can" Statement Posters
Translate the Common Core math standards into a series of achievable "I can" statements with this collection of classroom displays. Offering posters for each standard, this resource is a great way to support your seventh graders as they...
Rice University
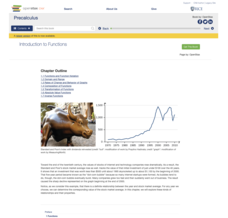
Precalculus
Take a step beyond Algebra 2. Learners use the eBook to learn concepts from the typical Precalculus course. Content starts off with a short review of functions in general and moves on to the basic functions, finishing up with more...
Curated OER
Transformations in the Coordinate Plane
Your learners connect the new concepts of transformations in the coordinate plane to their previous knowledge using the solid vocabulary development in this unit. Like a foreign language, mathematics has its own set of vocabulary terms...
Mathematics Assessment Project
Middle School Mathematics Test 3
Real-life mathematics is not as simple as repeating a set of steps; pupils must mentally go through a process to come to their conclusions. Teach learners to read, analyze, and create a plan for solving a problem situation. The provided...
Willow Tree
Solving Inequalities
What does solving an inequality have in common with solving an equation? Almost everything! A math resource focuses on the one exception. The examples lead learners through the steps of solving an equality when multiplying or dividing by...
Virginia Department of Education
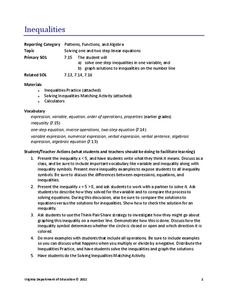
Inequalities
Not all resources are created equal — and your class benefits! Scholars learn how to solve one-step inequalities using inverse operations. They complete an activity matching inequalities to their solutions.
Los Angeles County Office of Education
Assessment For The California Mathematics Standards Grade 6
Test your scholars' knowledge of a multitude of concepts with an assessment aligned to the California math standards. Using the exam, class members show what they know about the four operations, positive and negative numbers, statistics...
Curated OER
Sunshine Math 3
In this word problems worksheet, learners read and problem solve nine mathematical word problems involving grids, measurement, compensation and angles.
Curated OER
The Personal Narrative - Part 3
Let's peer edit! Have your writers exchange their personal narratives with another learner! While peer editing, they will look for any missing information and identify strong details. They can practice literary analysis skills using a...
101 Questions
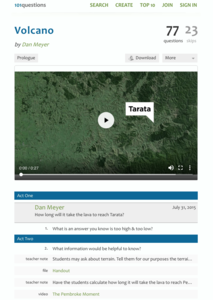
Volcano
This resource will blow your mind! Young mathematicians estimate the rate of volcanic lava flow by watching a video. They apply the rate formula to determine how long it would take the lava to reach a city. Let's hope everyone gets out...
Other popular searches
- Percent Circle Graph
- Circle Graph Worksheet
- Circle Graph Template
- Interpreting Circle Graphs
- Circle Graph Protractor
- Circle Graph Activity
- Reading Circle Graphs
- Circle Graphs Pie Charts
- Circle Graph Central Angle
- Bar and Circle Graphs
- Circle Graph in Excel
- Family Budget Circle Graph


