EngageNY
Forming a Research-Based Claim: Cascading Consequences Chart
Can you put that in writing? Scholars work with a partner to write a practice claim before writing their own claims. After writing their claims, learners share with class using a Concentric Circles activity.
Curated OER
Delicious Graphing
Fourth graders sort trail mix by type and use that information to create different types of graphs for comparing.
Curated OER
Area graphics for 7th graders
Students randomly select dimensions for three geometric shapes (square, right triangle and circle). From the graphs they compare and contrast the graphical results of each shape.
Curated OER
Graphing Inertia: An Oxymoron?
Eighth graders investigate Newton's Law of Inertia in order to create a context for the review of the use of different types of graphs. They practice gathering the data from an experiment and put it into the correct corresponding graph.
Curated OER
Introduction to Graphical Representation of Data Sets in Connection to Cellular Growth
Students practice graphing relationships between variables by studying topics such as exponential growth and decay. They conduct a series of numerical experiments using a computer model and a variety of physical experiments using mold,...
Curated OER
Data Days
Sixth graders practice collecting, organizing and displaying data. They create circle, bar, line and picto graphs. They analyze data in small and large sample groups.
Curated OER
Numeracy Practice- Going Out For Lunch
In this math learning exercise, learners complete the various types of activities that include graphs, data tables, and completing number sentences.
Curated OER
Birthdays
Students collect data about the birth months of each classmate using a calendar. They make a table with the information before designing a pictograph using cupcake images. They answer questions using the graph.
Curated OER
Conic Sections
Students, while using a graphing calculator, graph systems of conic sections as well as identify their solutions. They complete various word problems dealing with conic sections with their calculators. In addition, students sketch graphs...
Curated OER
Snake Sorting
In this sorting learning exercise, learners sort snakes with tongues out and snakes without their tongues out, count them, graph them and circle the one that has more. Students complete five activities.
Curated OER
Body Parts in Spanish
Students use Spanish to recognize and recall body parts. In this Spanish anatomy lesson, students identify and name the parts of the body in Spanish. Students describe a person physically by his hair and color of eyes. Students graph...
Curated OER
I Breath What? Activity-Pollution Detector Worksheet
In this pollution worksheet, students collect particles using a pollution detector and then observe their results under the microscope. They calculate the average number of particles collected in three different locations. They draw...
Curated OER
A Recipe for Air
Learners create a pie graph using M&Ms to demonstrate the composition of air. They label each section of the graph, and list the fractions from largest to smallest.
Curated OER
How's The Weather?
Students make a box and whiskers plot using the TI-73 graphing calculator. Each student would have their own calculator but they would work in small groups of two or three to help each other enter the data and make the plots.
Curated OER
The Unit Circle
Students relate the trigonometric functions to the coordinates of the unit circle. They classify trigonometric functions as odd or even. Students determine the signs of trigonometric functions in each quadrant. They are explained that...
Curated OER
Creating Pie Graphs Using Percents
Sixth graders examine how to convert fractions to percents and percents to fractions. They list their activities for a 24 hour period, and create a pie graph using Microsoft Works.
Curated OER
Graphing Grazy Crayons
Children create crazy crayons they made to sort and construct a floor bar graph. Then, using technology resources, they make a simple bar graph to compare the top four colors produced. Students will then interpret the printed graph by...
Curated OER
Finding the Basal Area of a Forest Plot to Determine Stocking Levels
Learners use graphs and plots to measure the basal area and stocking levels. In this graphing instructional activity students work in the field the use their data to help them complete a lab activity.
Curated OER
Cruising the Internet
Students identify the parts of an engine using a graph. In this statistics lesson, students make a graph from their collected data. They calculate the volume of a cylinder using a line of regression and a scatter plot.
Curated OER
Levers in the Body: They Are Not What You Might Think!
Students investigate lever systems in the human body and compare arm anatomy to model. In this human levers lesson students graph and analyze their results.
Curated OER
Comuter Technology-Applying Spreadsheet Information
Students create spreadsheets and practice sorting within the spreadsheet with three different activities. Students manipulate different materials such as addresses, real estate sales, and athletic participation numbers.
Curated OER
Exploring the Orthocenter of a Triangle
Young mathematicians explore the concept of triangles as they construct altitudes of triangles to find the orthocenter. Learners construct their triangles using Cabri Jr. on their graphing calculators and find that the altitudes of a...
Curated OER
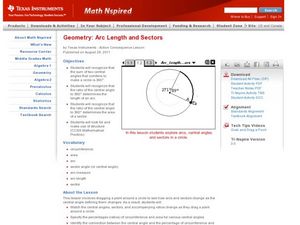
Arc Length and Sectors
Find the length of an arc. High schoolers relate central angles to the area and length of a sector and graph circles on the TI to make predictions.
Curated OER
Name That Tune: Matching Musical Tones Through Waveform Analysis
Pupils detect the waveform of musical notes to determine the code for the "safe" in this forensics simulation lesson. They use a microphone and tuning forks along with Vernier EasyData on their graphing calculator to analyze five musical...


