CK-12 Foundation
Evaluate Limits Using Graphs and Tables: Where Is That Limit?
Limits are made easy through graphs and tables. An easy-to-use interactive lets users change a function on a coordinate plane. They relate graphs and tables to the limit at a specific value.
CK-12 Foundation
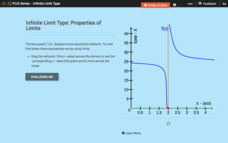
Infinite Limit Type: Properties of Limits
Limits can provide some valuable information about graphs. A slider interactive lets learners see the behavior of a graph around asymptotes. They investigate relationships between limits and asymptotes.
CK-12 Foundation
Vector Projection
Two words summarize the interactive: vector projector. An easy-to-use resource lets users investigate vector projections on the coordinate plane. Given the components of two vectors, they determine the projection of one vector onto the...
CK-12 Foundation
Sums of Integers with Different Signs: Adding Between 10 and -10
Six questions make up an interactive designed to boost scholars' knowledge of integers. Mathematicians move symbols over a horizontal number line to aid in findings answers between 10 and negative 10. Question types include...
CK-12 Foundation
Conversion of Decimals, Fractions, and Percents
Five questions—true or false and multiple-choice—challenge mathematicians to convert decimals, fractions, and percents. An interactive table displays how to write a portion of shapes in a variety of ways. A discussion question concludes...
Curated OER
Using Technology To Teach Parallel Lines With Transversals
Students explore the relationships between angles formed by two lines cut by a transversal when lines are and are not parallel. They define key vocabulary terms, then using a camera take pictures at their school of parallel lines with...
Curated OER
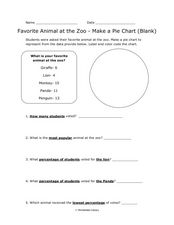
Pie Chart: Favorite Animal at the Zoo
In these three interpreting a pie chart and answering questions worksheets, learners use the data provided to label and color code the blank and outlined pie charts, read and interpret a completed pie chart, and then answer questions...
Curated OER
Weather Graph
In this graphing activity, learners read the average monthly maximum and minimum temperatures in Paris and use them to complete a color coded line graph. Students graph 24 figures.
Curated OER
Translating Digital Graphics
In this technology worksheet, students translate digital graphics using prime numbers. They rewrite the codes as sentences. There are 4 transmissions to be decoded with some hints.
Perkins School for the Blind
Integrated Skills - Laundry
I hate doing laundry, even if it is an independent living skill that requires me to count money, follow a sequence, and sort clothing by color. Learners with multiple disabilities discuss what laundry is, why they need to do it, and how...
Curated OER
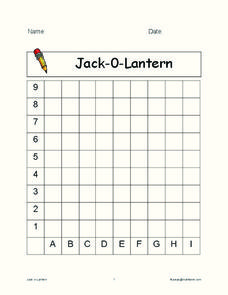
Jack-O-Lantern
In this Jack-O-Lantern coordinate grid worksheet, students read coordinate letters and numbers, locate the squares, follow the color code chart, and color the Jack-O-Lantern. Students solve thirty-five coordinates.
Curated OER
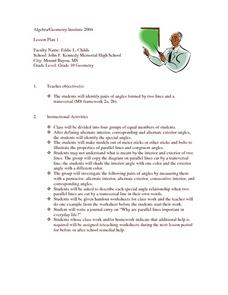
Transversal and Angles
Tenth graders identify angles formed by parallel lines and a transversal. Using meter sticks and bolts, they perform hands-on activities to demonstrate the properties of parallel lines and congruent angles. They color code diagrams to...
EngageNY
From Ratio Tables to Equations Using the Value of a Ratio
Use the value of a ratio to set up equations. The teacher leads a discussion on determining equations from ratio tables in the 13th portion of a 29-part series. Pupils determine which of two equations to use to find the solution....
Curated OER
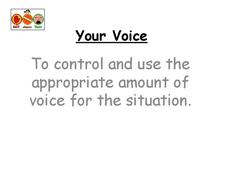
Your Voice
This is a very interesting resource that could be a helpful tool in the right context. Learners discuss the appropriate speaking volume needed in given situations. They practice one-on-one discussions, class discussions, and responding...
Mathed Up!
3-D Pythagoras
Apply the Pythagorean Theorem in three-dimensional shapes. Young mathematicians watch a video that takes them through several examples of using the Pythagorean Theorem to solve problems involving lengths in three-dimensional figures. A...
Curated OER
U.S. States - The Midwest States
In this geography and math activity, students complete the simple addition equations and match the sums to the colors. Students then color the Midwest States by the color code.
Curated OER
Country Flags
In this country flags worksheet, students complete the simple addition equations. Students then match the sums to the color code, color the birds and flags of the countries.
Curated OER
Parallel and Perpendicular Lines
Fourth graders examine parallel, perpendicular and intersecting lines. They create a drawing using examples of each type of line. They color code and explain the characteristics of specified lines.
Curated OER
Addition of Shapes
In this finding the sums activity, students add color coded shapes and corresponding numbers to problem solve sums from two to nine. Students solve 6 problems.
National Security Agency
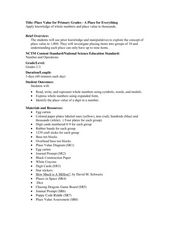
Place Value for Primary Grades- A Place for Everything
Here is a phenomenal lesson on place value to the thousands place. Learners construct numbers and identify the value of each digit, investigate building numbers using craft sticks and paper plates, and complete other meaningful...
Curated OER
Monarch Butterfly Migration Map
Students examine the migration patterns of the monarch butterfly. They practice using color-coded maps. They create their own maps based on the butterfly's migration. They share their maps wtih the class.
Curated OER
Geo Jammin' - Day 3, Lesson 11: Poly Doodles All Day
Learners explore geometric vocabulary through creation of shapes on a geoboard. They present design attributes, transfer of design, and color-coding components mix to create a fun and exciting lesson plan that stretches student thinking.
Curated OER
Measurement of Angles
Pupils measure angles that are formed by parallel lines and a transversal lines. In this angles lesson plan, students measure and define angles that are made by parallel and transversal lines. They will color code the angles based on the...
Curated OER
Easter: Multiply by 2
In this Easter multiplication facts practice worksheet, students use their math skills to solve 16 problems that require them to multiply by the number 2. Students then color the Easter eggs according to the answer color code chart.


